How to Really See What’s Happening In Real-Time Event Processing Systems1
by David C. Luckham
June 2021
Event processing systems are the foundation of modern society. Now-a-days they are the technology upon which everything operates – the Internet, the Stock Market, Electrical Power Grids, Government Intelligence, Transportation and so on. The ability to monitor in real-time how these systems are performing is essential. Consequently niche industries have arisen that supply specialized monitoring tools for the event processing systems in specific markets such as corporate networks, manufacturing systems, e-commerce systems, Airline operations, Smart Electrical Grids, and many other areas.
Each purpose-specific monitoring tool provides the user with a fixed set of concepts. Many of these concepts are closely related to standard Key Performance Indicators (KPIs) in a specific industry. Interestingly, these tools have predefined, implicit event hierarchies that are designed to handle a fixed set of input base events. They compute a fixed set of higher level complex events that abstract data in the inputs that are relevant to the business task at hand. The user must understand the significance of the higher level output events. They may be displayed on a real-time dashboard; sent to a mobile device or a device to trigger an immediate response; or written into a database for further analysis using an offline business intelligence (BI) or data science tool. Users can control certain parameters, such as the time window they want to monitor, the thresholds for triggering alerts, and the mathematical operations that should be applied to the incoming data.
Tools for monitoring factories display a set of events related to equipment availability, quality, loss and overall equipment effectiveness (OEE). Network monitors usually provide measures of response time, consistency, reliability based on real-time and historical performance data. Electrical grid monitors will show events related to overload and imbalance conditions, outage duration, and statistics related to line faults.
However, what is really needed is a platform that allows the user to define his own ways of viewing the target system, how he wants to see it, and what he is interested in monitoring. Specifically, one would like a capability to detect patterns of events in the input flow, where the patterns can involve causal relationships between events, and then to create higher level events that abstract those patterns as they occur in real-time. A key factor is a powerful language for specifying patterns of events. None of the current commercial monitoring platforms on the market give a user this degree of flexibility. Additionally, the platform should be tailorable to any target event processing system in any industry.
CEP was developed at Stanford University for precisely this purpose; to provide an infrastructure for building stream analytics solutions that provide real-time monitoring of event processing systems. CEP allows users of a system to specify the information that is of interest to them in a hierarchical form. It can be low level network processing data or high level business management intelligence, depending upon the role and viewpoint of individual users. And it can be changed from moment to moment while the target system is in operation.
The basic idea is very simple. Low level events are flowing into an event viewer tool from a target event-driven system. There may be thousands of low level events per second. The user is interested in seeing the data in particular patterns of events in the flow, in real time. In some cases he or she may be interested in patterns in which events cause other events to happen. So, using CEP, they can define pattern-triggered rules that will match those patterns of events of interest; and when a match occurs, the rule then triggers and creates new events that abstract the data from the pattern instances. This will result in a flow of higher level abstract events, usually far fewer in number. The user can repeat this process by defining more rules that trigger on event patterns in the abstract event flow and then produce even higher level events. The result is a dynamic hierarchy of abstract events that are created from the stream of low level events from the target. If the user constructs their rules intelligently, the higher level events will provide a humanly understandable real-time view of what is happening in the target system.
In addition, the pattern triggered rules can be changed at any time to suit changes in the user’s interests or to answer questions that may arise as a result of ongoing activity.
Event hierarchies in which the levels of events are defined by event pattern rules, are called Constructive Event Hierarchies because the higher level events are constructed by triggering the rules. And higher level events are called abstract events because they contain, or abstract, data contained in sets of events at lower levels. Also, the history of how any abstract event was created as the result of a rule being triggered, is retained for the purpose of analysis. This allows a user to “drill down” through the levels of the hierarchy from any abstract event to recover the lower level events that led to its creation.
CEP can be used to build constructive event hierarchies that enable a user to view and understand the activity that is happening in many different event-driven systems. Here are two examples.
Manufacturing: the management of a chip fabrication plant might use hierarchical monitoring starting from low level events that are the sensor readings from each machine in the plant. Typical sensors continuously report a machine’s power consumption, processing time for each cycle, temperature and so on. Other events will be related to the progress of each pallet of chips in the fabrication process. The second level abstract events could be indicators of trends and patterns in the sensor readings, such as increasing temperature or irregular processing times or total power consumption of machines, or the time a pallet spent in a machine or the chemical analysis of its processing. At a yet higher level the abstract events could be a warning that a machine is becoming inefficient, or too costly to operate, predictions of the possibility of bottle necks, or indeed that a failure was likely within a given time window. At the highest level one might expect to see abstract events arriving on an hourly or daily schedule that give various views of the overall performance of the plant, the quality of its output and its productivity and efficiency. Analysis features should make it easy to query an event that reports reduced productivity by drilling down through the event hierarchy to find which machines are underperforming, even going to the bottom level sensor readings if necessary. The event throughput in such a hierarchy would be thousands of lowest level events per second and perhaps a hundred highest level events per hour.
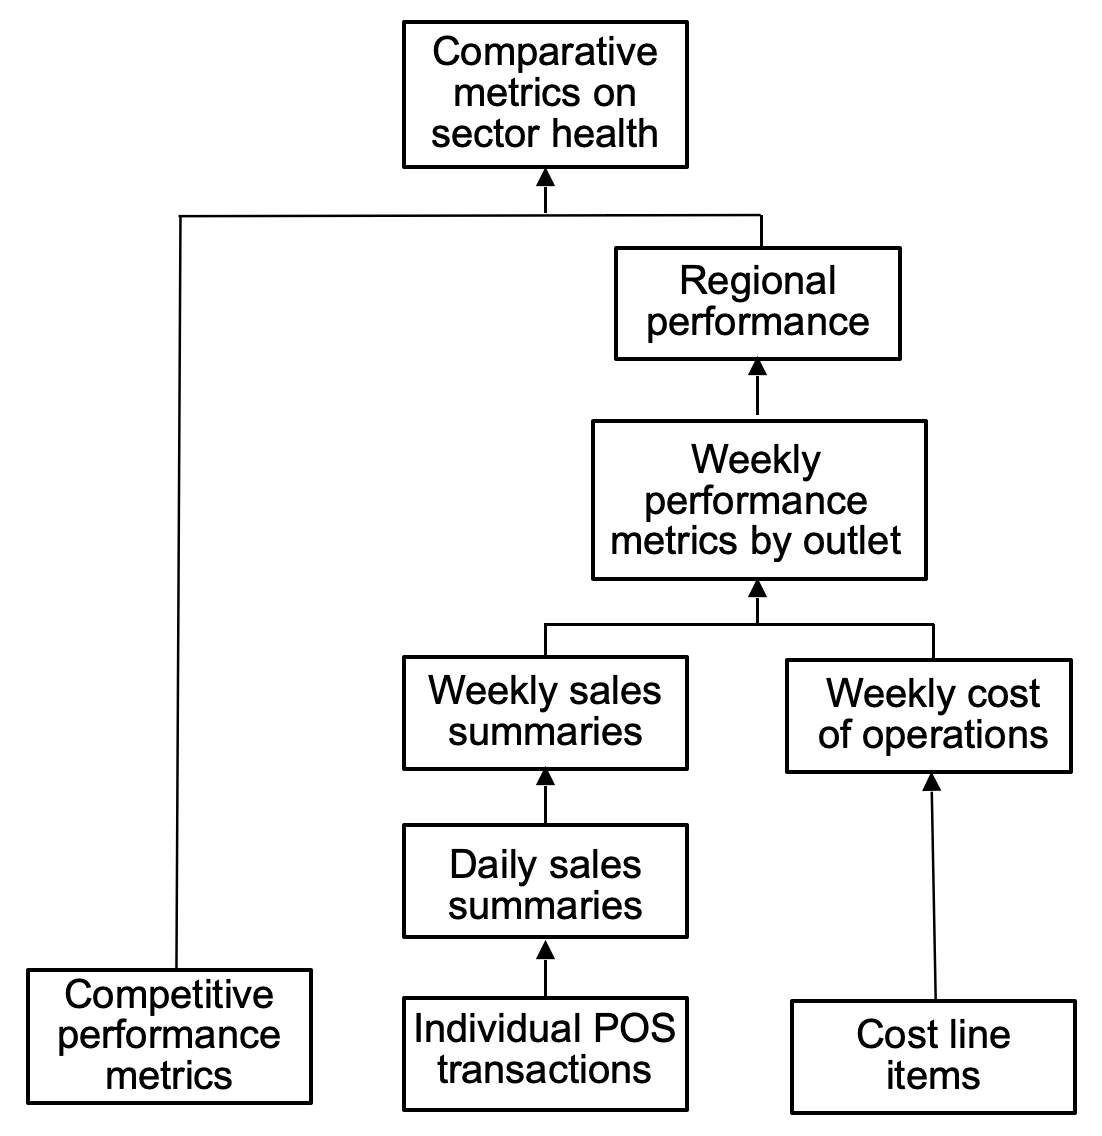
A National Retail Business: Corporate management wants to build a hierarchy that gives them real-time views of the performance of the business by region with an ability to immediately detect the causes of variations of performance in any region. We may suppose that the lowest level events are point of sale (POS) records for individual transactions. The next level up are events that report the hourly or daily figures for sales, stock availability, deliveries and supply chain issues, personnel issues, and cost of operation for each retail outlet. The third level events would be performance events for each outlet constructed from its sales and costs events, and the performance of the supply chain. Constructing performance events at each level would involve complex algorithms using patterns of the lower level events together with various analytics. At the next higher level we might see performance events for each geographical region of the country that abstract the individual performance events created from each retail outlet in that region. At the top level, which might be half a dozen levels higher, would be abstract events that are measures of corporate profitability and competitiveness.
Figure 1 illustrating the levels in this kind of hierarchy, is shown below. The events in this kind of hierarchy are created hourly or daily at the lower levels and probably arrive daily and weekly at the highest level.
Also, a detailed technical report illustrating the actual use of a constructive event hierarchy to monitor and analyze the behavior of a chip fabrication line is included in this CEP website. This experiment was done in 1998 using the Stanford Rapide analyzer. Although more than 20 years old, this work is still directly relevant to event processing businesses today and goes beyond many of the current capabilities in use. It shows how an abstract event hierarchy was constructed in real-time as the fabrication line was running, by applying CEP rules that triggered on patterns of events in the stream of low level communication events generated by fabrication line equipment. Also, the use of drill-down techniques to recall how a high level abstract event was constructed from lower level events is shown in detail.
Footnotes
1 I wish to thank Roy Schulte for improvements and additions to drafts of this article and for Figure 1.
Leave a Reply
You must be logged in to post a comment.