Monitoring A Chip Fabrication Facility In Real-Time Using Complex Event Processing
David Luckham and Brian Frasca
This paper presents an overview of Complex Event Processing applied to a particular example of a distributed message-based system, a fabrication process management system. The concepts of causal event histories, event patterns, event filtering, event aggregations and event hierarchies are introduced and their application to the process management system is illustrated by simple examples. This paper gives the reader an overview of Complex Event Processing concepts and illustrates how they can be applied using the RAPIDE toolset to one specific kind of system.
- Towards Hierarchical Viewing
Many computer systems in operation today are distributed systems. Typical examples are systems supporting commercial applications such as distributed financial transaction processing systems, warehousing systems, and fabrication process control systems. Generally speaking, the business operations of any global corporation are sup- ported by a widely distributed, message-based computer system. Military command and control systems are also distributed systems. Although the types of component objects in commercial and military systems are mostly different, the underlying paradigm is the same: a widely dispersed set of several hundreds or thousands of application pro- grams (or objects) communicating with one another by means of messages transmitted over various kinds of media.
In distributed message-based systems the component objects are communicating with one another “at a distance” by means of sending messages or by remote method invoca- tion. Communication between objects uses a communication layer. This is a medium that can vary from something as primitive as Ethernet to higher level communication layers such as the Internet or some more specialized kind of middleware. Middleware for distributed applications includes CORBA ORBs and Information Busses. Middleware provides a layer of communication protocols together with APIs that the objects of a system use to communicate. It contains, and hides, lower level networks, databases, demons and other such stuff. There are several widely used commercial middleware products that form the communication layer for largescale business enterprises (see e.g., [Gro91], [TIB]).
The communication layer is usually viewed as being the lowest levels of a distributed system. Newspaper articles refer to it as the “under-the-hood” part of, say, a popular multimedia product hosted on the Internet. It is generally looked upon as something the common man should not know about and certainly not tinker with — it is a source of evil and many system problems. And when it collapses in one of many well-known or not so well-known ways, the system grinds to a halt. We often hear “The network is down.” Network crashes can become a critical concern to the higher level echelons in a distributed enterprise. So the communication layer becomes the domain of a powerful new kind of gnome, the specialist in network management, to the exclusion of all others in the system.
1.1 Today’s diagnostics are too low level
Most distributed systems have built-in diagnostics to try to solve the network man- agement problems. They use the communications layer to record and log particular kinds of messages (also called events) that indicate the performance of basic operations such as network functions. The event logs are fed to various commercial viewing tools. System administrators can view the logs and perform different kinds of measure- ments on them. This gives a primitive way of keeping track of how the communication layer is behaving and detecting overloading or failures on various pathways through it. Providing one can figure out from the event log exactly what is happening in the communication layer, action can be taken to keep the system’s communications operating smoothly. At present, the number of event viewing and analysis tools is expanding rapidly to meet growing commercial needs.
But event-based diagnostics is still at a very primitive, embryonic stage. The kinds of events that are logged are low level events. They are intended to deal with network and communications layer management. The event logs can become very large. Events that indicate related activities in the communication layer may appear to be widely separated by other events and by time. And there may be a lot of irrelevant events mixed in with ones of interest. Techniques to “pick out” events of interest are needed. Also, the event logs lack causal information — i.e., which events caused some event to happen. This means that when we view a large event log, and an event that indicates an error turns up, like a server going down, we cannot immediately focus on the other events in the log that led up to the failure. Instead, we have to use a lot of knowledge about the network to try to figure it out. So, even at the communication level, the event logs are hard to analyze and interpret usefully.
But getting information about application level activities is in even worse shape. At present the low level event logs are not used to help with problems in other layers of the system, say in the component objects rather than in the communication layer. To help us identify problems in the objects, we need to be able to relate sets of communication events with higher level operations that the objects perform. So far, the technology to do this has not been available.
There are also problems of “inflexibility”. In many situations, we need the objects to generate meaningful events about their activities too — not just the network. Also, the types of events that are generated in present day diagnostics are designed into the system when it is built. So we lack the flexibility to generate new types of events to deal with new or unexpected problems that turn up while the system is in operation. We need to be able to vary the set of events that are generated by the system to fit with what we are interested in at any time.
1.2 The need for flexible multilevel viewing
So when we look at the current state of event-based diagnostics we see the need for more powerful monitoring and viewing tools. And the basis we need to do this is the ability to aggregate sets of low level events into higher level events that give us information about what the component objects of the system are trying to do at the application level. For example, we would like the ability to:
- easily specify “interesting events” in large event logs, and filter them out from the rest of the events,
- aggregate sets of low level events into the corresponding abstract higher level events that they signify,
- detect causal relationships between events (at any level of abstraction) that hap- pen at different times in various subsystems,
- monitor event logs at any abstraction level during a system’s operation, and automatically detect violations of critical requirements (e.g., security violations).
RAPIDE complex event processing lets us add such capabilities to a distributed system. We apply this technology to the communication layer and existing low level network event logging facilities. When we do this, not only do we improve the monitoring and diagnostics at the network level, but we can provide system viewing and management at any level in the system. The communications layer now becomes a source of infor- mation — not just a source of aggravation. Also this technology is flexible. We can add new kinds of event-based viewing to a system, as and when needed, on the fly while the system is in operation.
In this paper we illustrate the concepts of RAPIDE complex event processing and how they apply to a particular system — a fabrication process management system.
- Abstraction Hierarchies and Flexible Viewing
A very powerful technique to help in understanding a complex system is to separate the system’s activities and operations into layers. This is called an abstraction hierarchy. It allows us to view the system’s activities one layer at a time. For example, we don’t have to think about low level packets of bits, headers and timeouts, at the same time as we think about higher level operations such as sending and receiving Email. The sets of operations are separated into different levels. We can translate the high level activities to a lower level when we want to.
Some abstraction hierarchies have become international standards, such as the ISO OSI inter-connection reference model for network-based systems [Int87] shown in Figure 1. In the case of the ISO standard, protocols are defined to specify the activity at each level in terms of the operations at that level. And relations between the operations at different levels are also defined precisely.
RAPIDE complex event processing lets us apply to any system the idea of organizing activities and operations into an abstraction hierarchy. In the case of message-based systems, we can organize the activities and events into layers. The events include the messages generated by the system, but in addition there are events that denote other activities such as a change of state of a component or the start or completion of a task, perhaps high level tasks. Events are like messages in form (they contain data etc.) but in addition they also denote activities. A typical low level example is a heartbeat event, which is a message “I’m alive”, that denotes (and lets other components know) that the source component is still active. In fact, an event always denotes an activity.
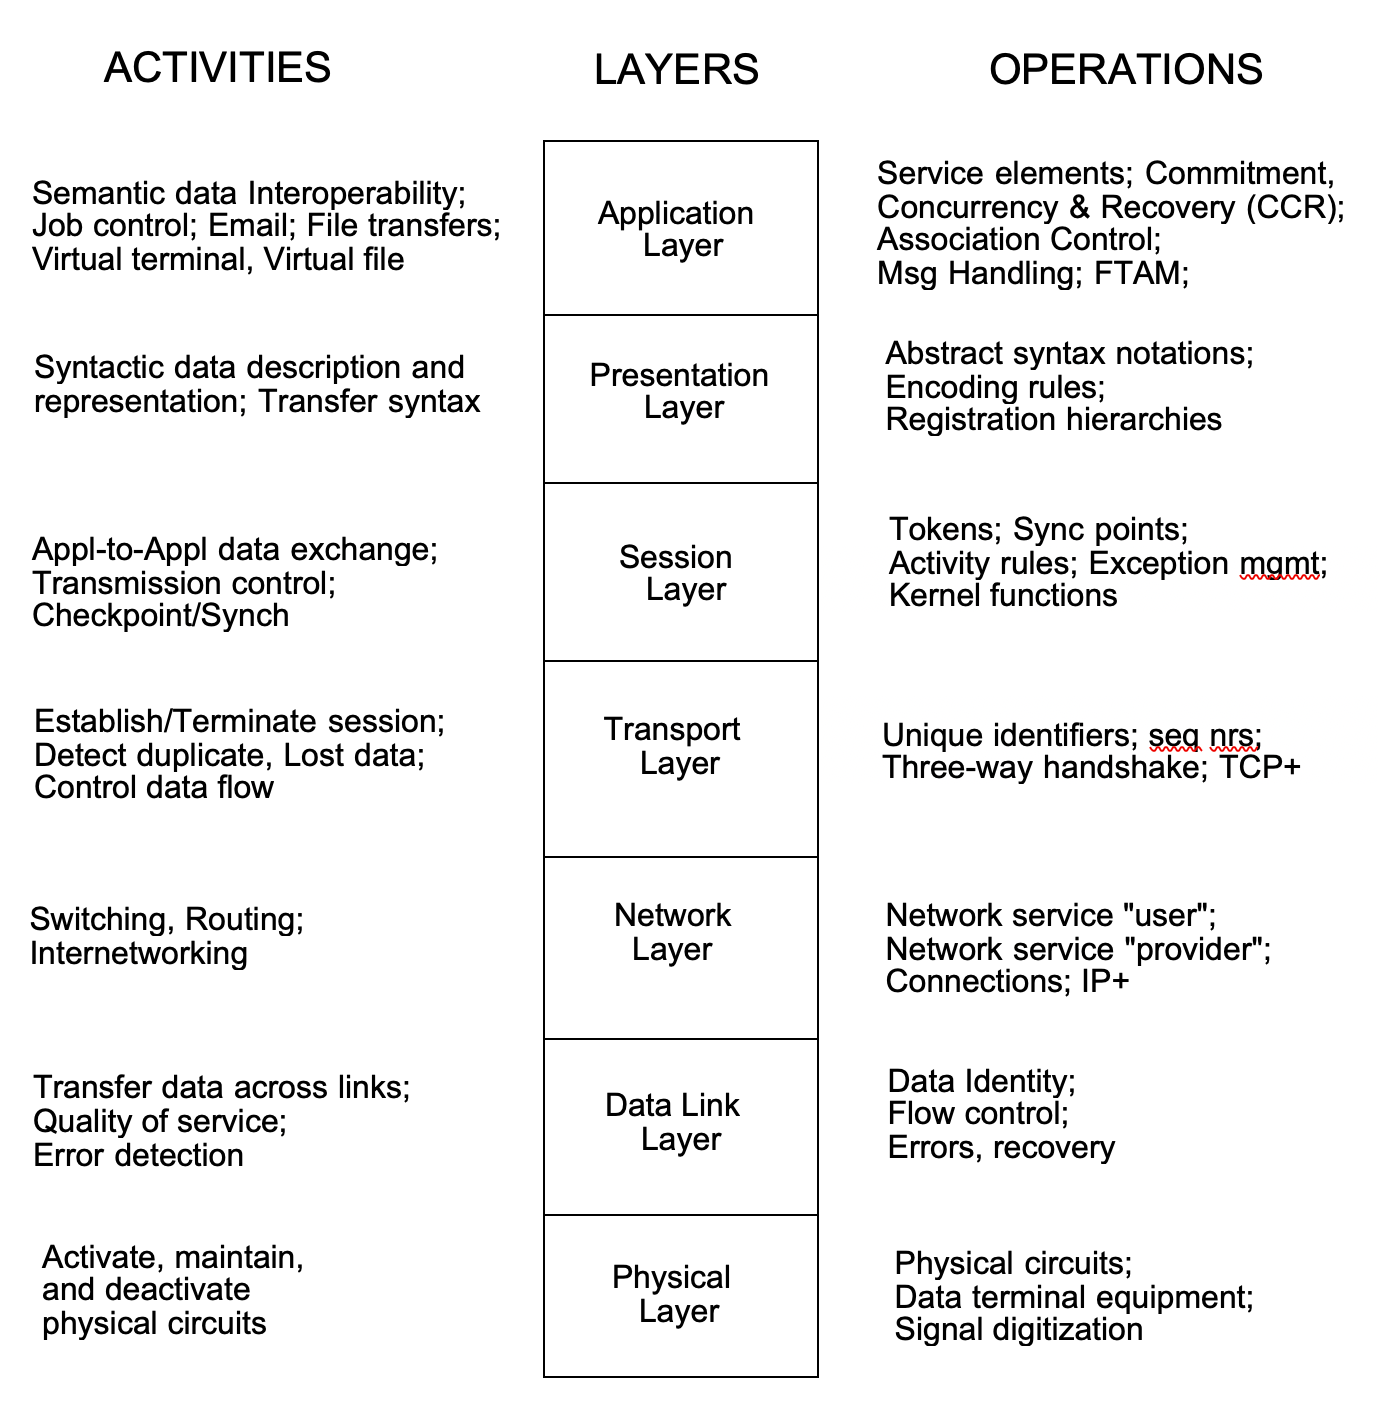
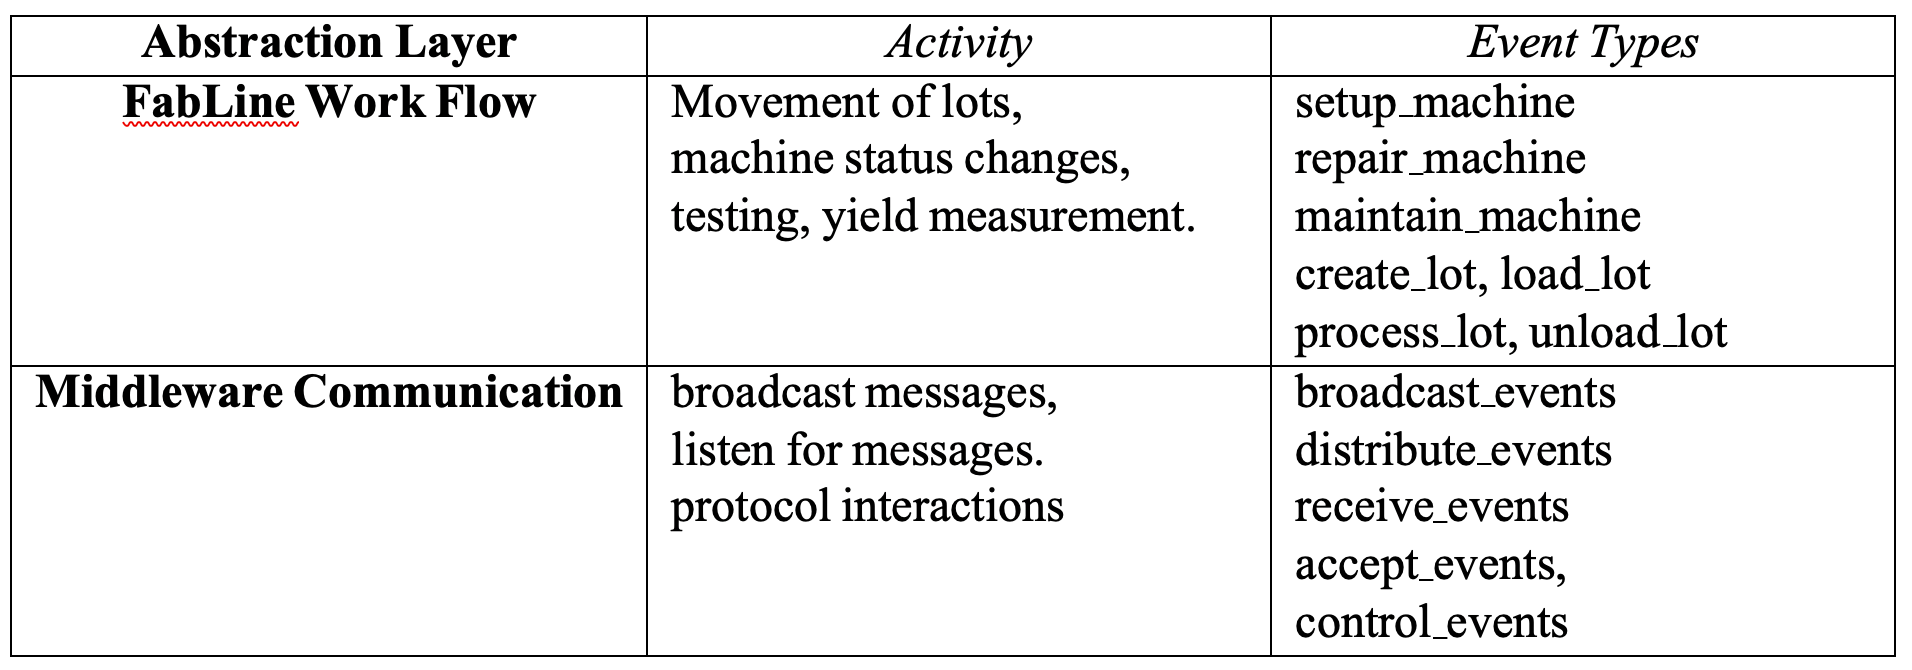
Figure 2 shows a two-layer hierarchy for a Fabline. Higher level events are related to fabrication line work flow activities such as moving lots in and out of equipment, processing lots inside equipment, and measuring lot yields. The lower level events denote communication between the computers that manage the robots and equipment; these are middleware messages sent and listened to by the computers, and also middleware control events.
Event hierarchies give us a way to view and describe the activity of a system at different levels of detail. At the lowest level are “actual events” denoting the operations at that level. They are generated by the system. Events at higher levels are “virtual” in the sense that they are composed of sets of lower level events. The compositions (or maps) between sets of events at different levels must be defined in order to specify a hierarchy completely.
For example, Figure 3 shows a mapping between events at the middleware commu- nication layer and an event at the fabline workflow layer. Events are drawn as nodes and causal relations as arrows. The pattern of events on the left side consist of a broadcast from, say an operator, which goes on the middleware (in this example, a model of TIBCO Rendezvous) and causes a distribute event, which in turn causes multiple receive events at the middleware’s clients (control system computers). One control computer accepts the message. The result at the fabline work flow level is a virtual Load Lot event. It denotes the workflow activity of loading a lot into some equipment.
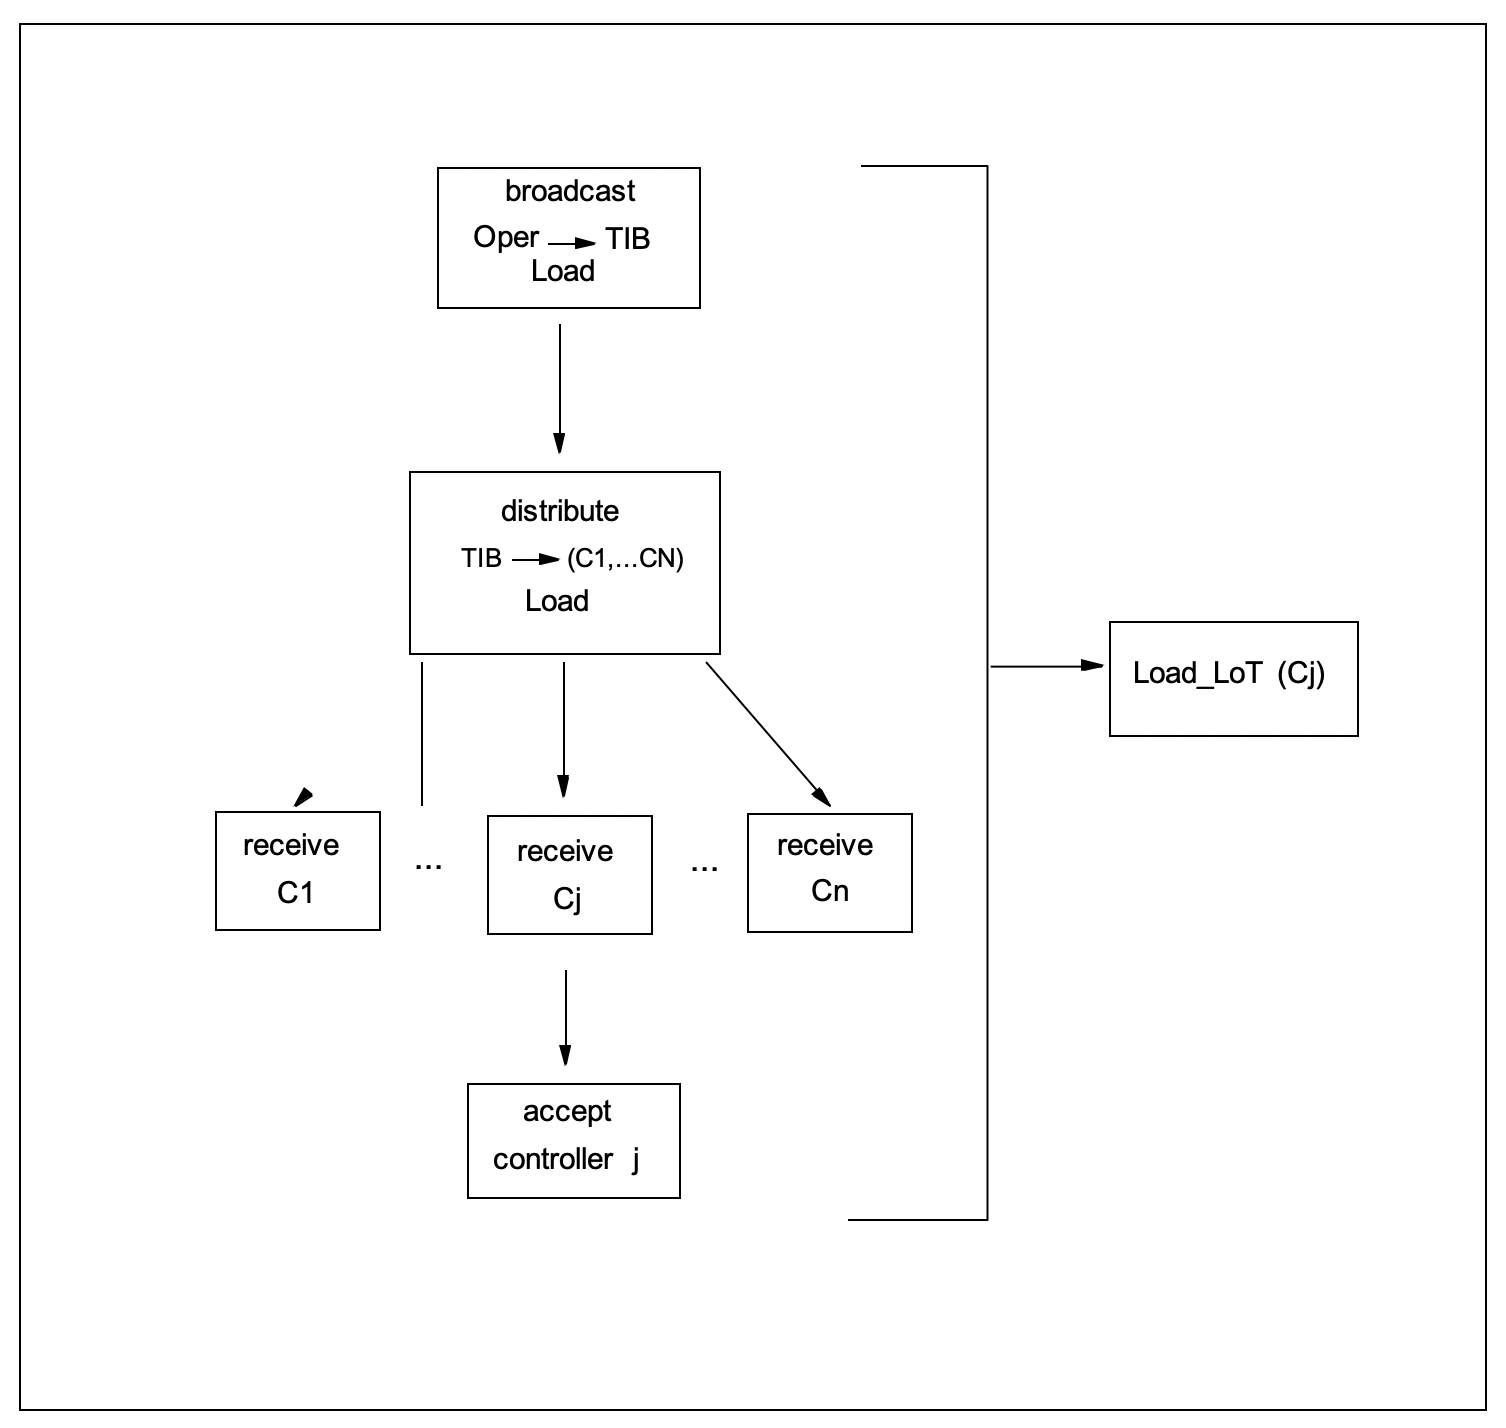
The causal relationships are important because there can be several such communica- tions involving similar messages going on concurrently. Causality allows us to quickly detect which communication layer events are playing in the same fabline workflow activity. A set of events together with relationships between them, such as causality, is called a poset (partially ordered set of events).
If we define an abstraction hierarchy, RAPIDE complex event processing allows us to construct the higher level events and process them exactly as any other events. This is done by two kinds of objects:
- filters. Filters take posets of events as input and output some of the input events. Filters are defined by event patterns. They output (or pass through) those input posets that match their patterns. Their effect is to reduce the number of events, hopefully to those of interest or importance.
- Maps. Maps take posets of events as input and generate new events. They are defined by pairs of input and output event patterns. Whenever a subset of events in the input matches an input pattern, a map reacts by generating the events in the corresponding output pattern. Maps are also called aggregators. Their purpose is to construct higher level events.
The basis for defining maps and filters is event patterns about which we will say more later.
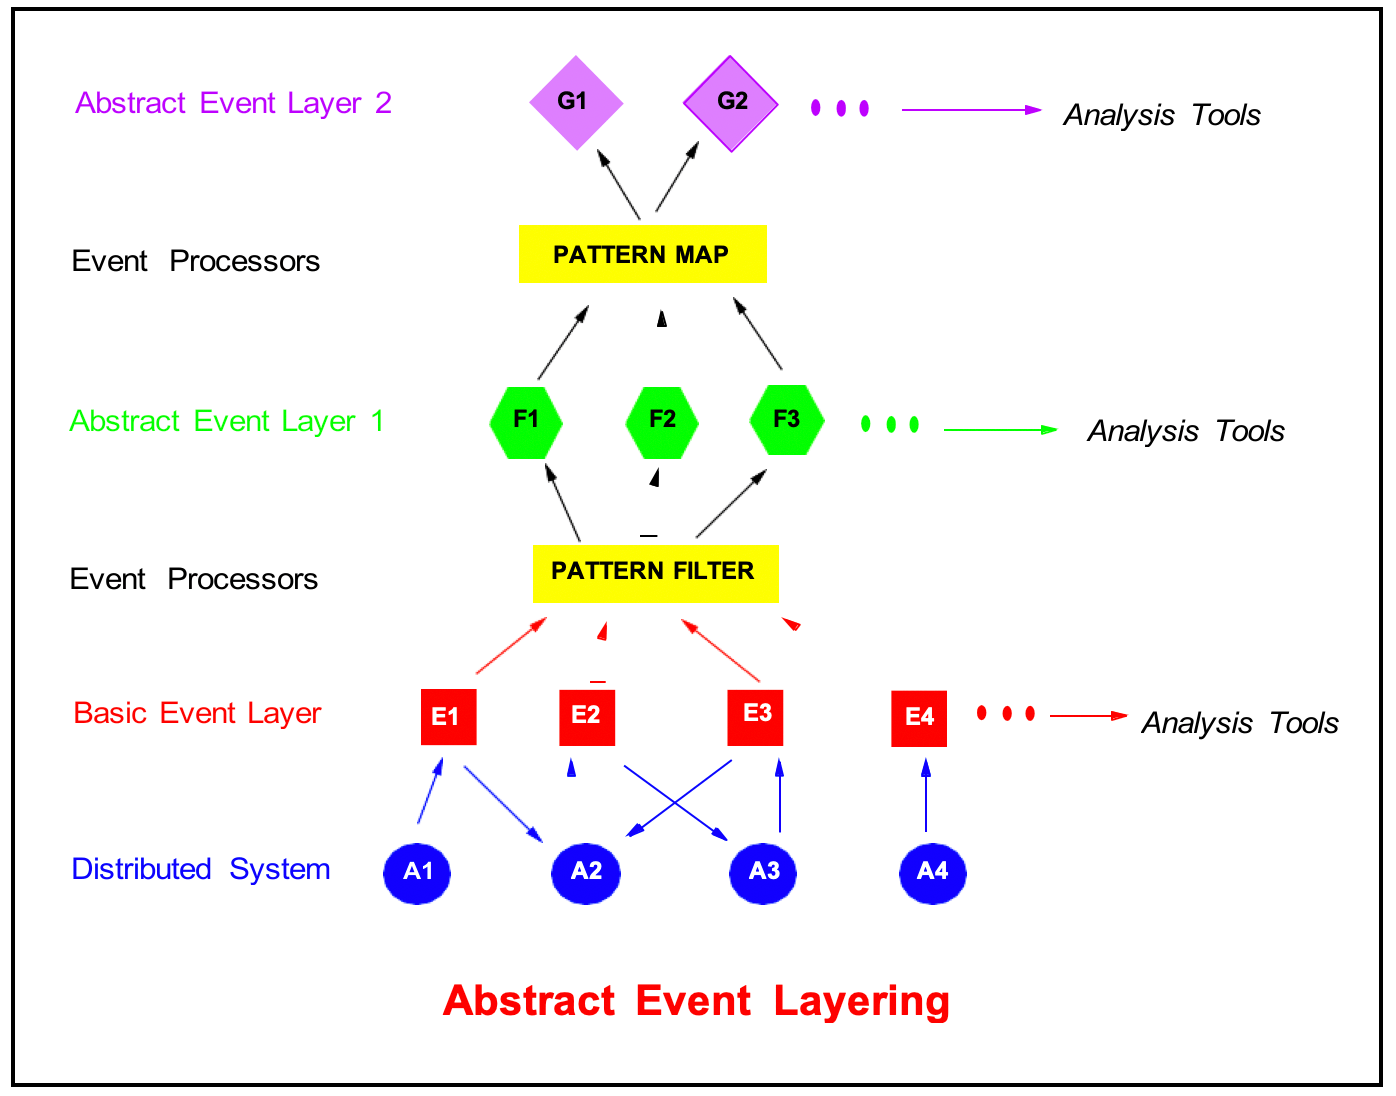
Filters and maps are hosted on the communications layer of a system. The basic events from the system are input into a network of filters and maps which is configured into a hierarchy corresponding to an abstraction hierarchy, as shown in figure 4. The filters and maps output their events for the next set of filters and maps in the network to accept. The abstract events are hidden from the target system and are only processed by the event processing network. The events at each level can be processed and viewed by various analysis tools. So, now the “under the hood” part of a distributed system is harnessed to enable us to view a system’s behavior at any level of detail.
A view of a system’s behavior contains events, and relationships between the events, corresponding to a level in an event hierarchy. A view may contain only a subset of the events at a given level. By defining an abstraction hierarchy we define different levels at which we wish to view a system.
Flexible viewing allows us to change our view while the target system is operating. For example, a fabline operator may be happy viewing the workflow events until something fails. Then the operator may want to view the relevant events in the communication layer to determine whether there is a problem in a control computer (which one) or a database or in the communication layer. This example requires a change between related views, from a higher level view to a lower level, more detailed, one that contains the events that are related to some part of the higher level view. To change between related views we need the maps — as we illustrate later.
Flexible viewing also allows us to change the event abstraction hierarchy. For any given system there are many possible event abstraction hierarchies. Only the lowest level activities and events are common to all hierarchies. During the operation of a system the users may want to define not only new views of the system, but also a new abstraction hierarchy. So the hierarchy needs to be changed. A very simple example would be when there are equipment substitutions on the production line. New types of events will appear on the communication layer. Neither the fabline nor the viewing of it should be halted to change either a hierarchy or a view.
RAPIDE tools let us make both kinds of changes dynamically while the system is in operation. New maps and filters can be dynamically specified and the network of maps and filters dynamically reconfigured to provide the required change of hierarchy and view while the system is in operation.
- Causal Event Histories
Complex event processing operates not only on sets of events but also relationships between events. Relationships between events can be specified in event patterns in maps and filters.
Events in a distributed system have various relationships to one another. Time with respect to a system clock is one relation: event A happened before event B. Usually timing is represented by timestamps in the events. Cause is another relation: event A caused event B to happen. And conversely, A and B are independent if they are not causally related. Causal relations can be encoded in genetic data in the events or by other means (see references to RAPIDE [LKA+ 95], [LV95]).
There are different ways that a causal relation can be defined. For example, activities such as two threads synchronizing by means of locks, or writing and reading the same object, may imply a causal relation between events in the two threads. These are examples of computational cause, so called because the causal relation is directly implied by the semantics of the operations being performed in the computation that is generating the events. We can also infer causal relations between events from the semantics of the programming language (say Java) of the system and the semantics of the operations in the communication layer (say, TIBCO Rendezvous).
There are other models of causal relations between events that can be defined using statistics and probabilities. These causal models can also be used in complex event processing. Probabilistic models of causality should be supersets of computational causality in the sense that if any two events are causally related by the computation then they must be related by any probabilistic model of cause, but the probabilistic model may also relate other events as well. So, computational causality is the minimal causal relationship between events that is imposed by the target system itself. It does not include effects external to the system such as social and economic forces, or effects of Nature.
Network management tools today do not provide explicit causal event viewing, but rather work on traces of events. Event traces are sets of events, possibly ordered by timestamps, but not containing any explicit representation of causality between the events. Causality can sometimes be deduced from data in the events, or from proba- bilistic models defined by the system builders (this latter being unreliable). Complex event processing works with explicit representations of event causality, and works with any model of cause. Our examples in this paper use computational causality.
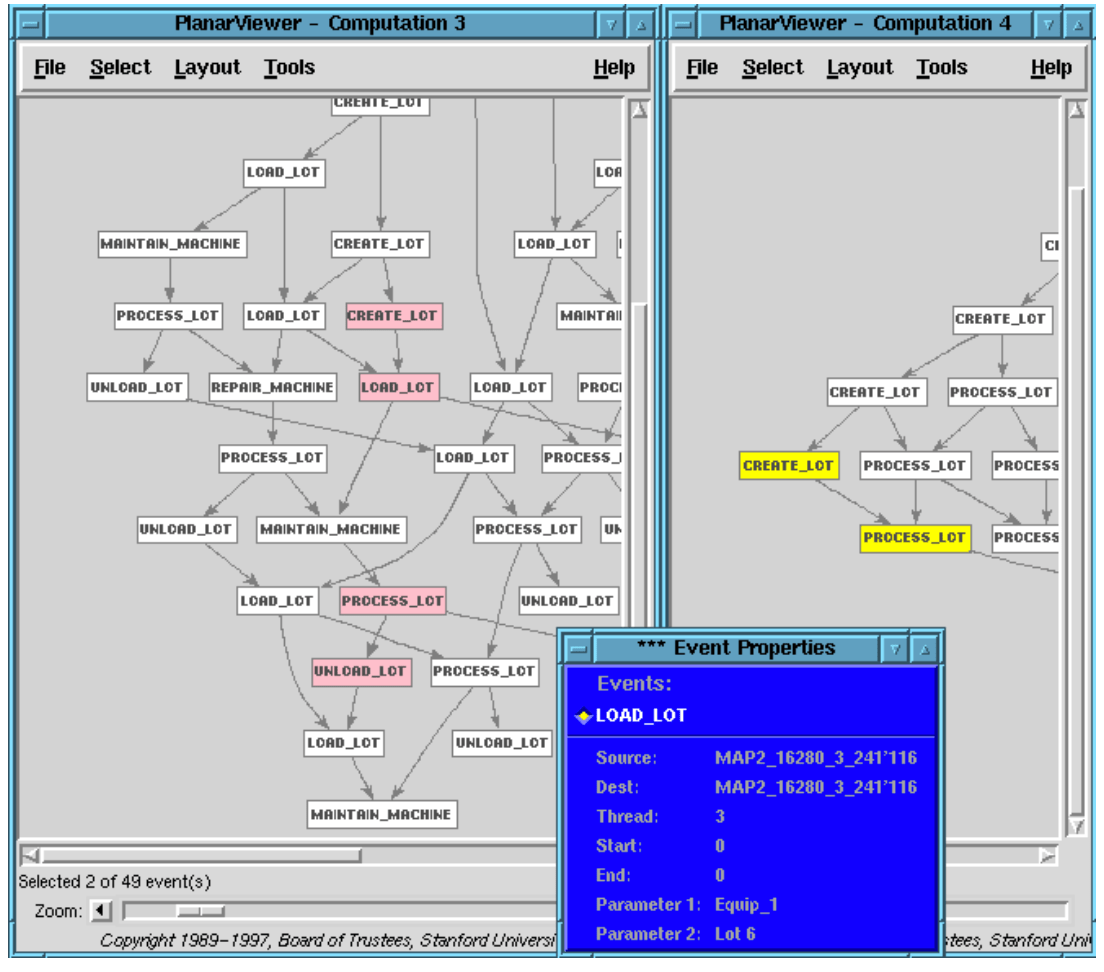
Figure 5 is a snapshot of part of a causal event history from a RAPIDE poset viewer. It is a poset showing a view at the Fabline workflow level. Nodes represent events and directed arcs represent causality. So the topmost Create Lot event causes two events below it, another Create Lot and a Process Lot event. The insert windows show the parameters of the highlighted events. So we see that the first and second Create Lot events were generated by thread 0, which is why they are causally related. They denote creation of Lot1 and Lot2 (parameter1 of a Create Lot event).
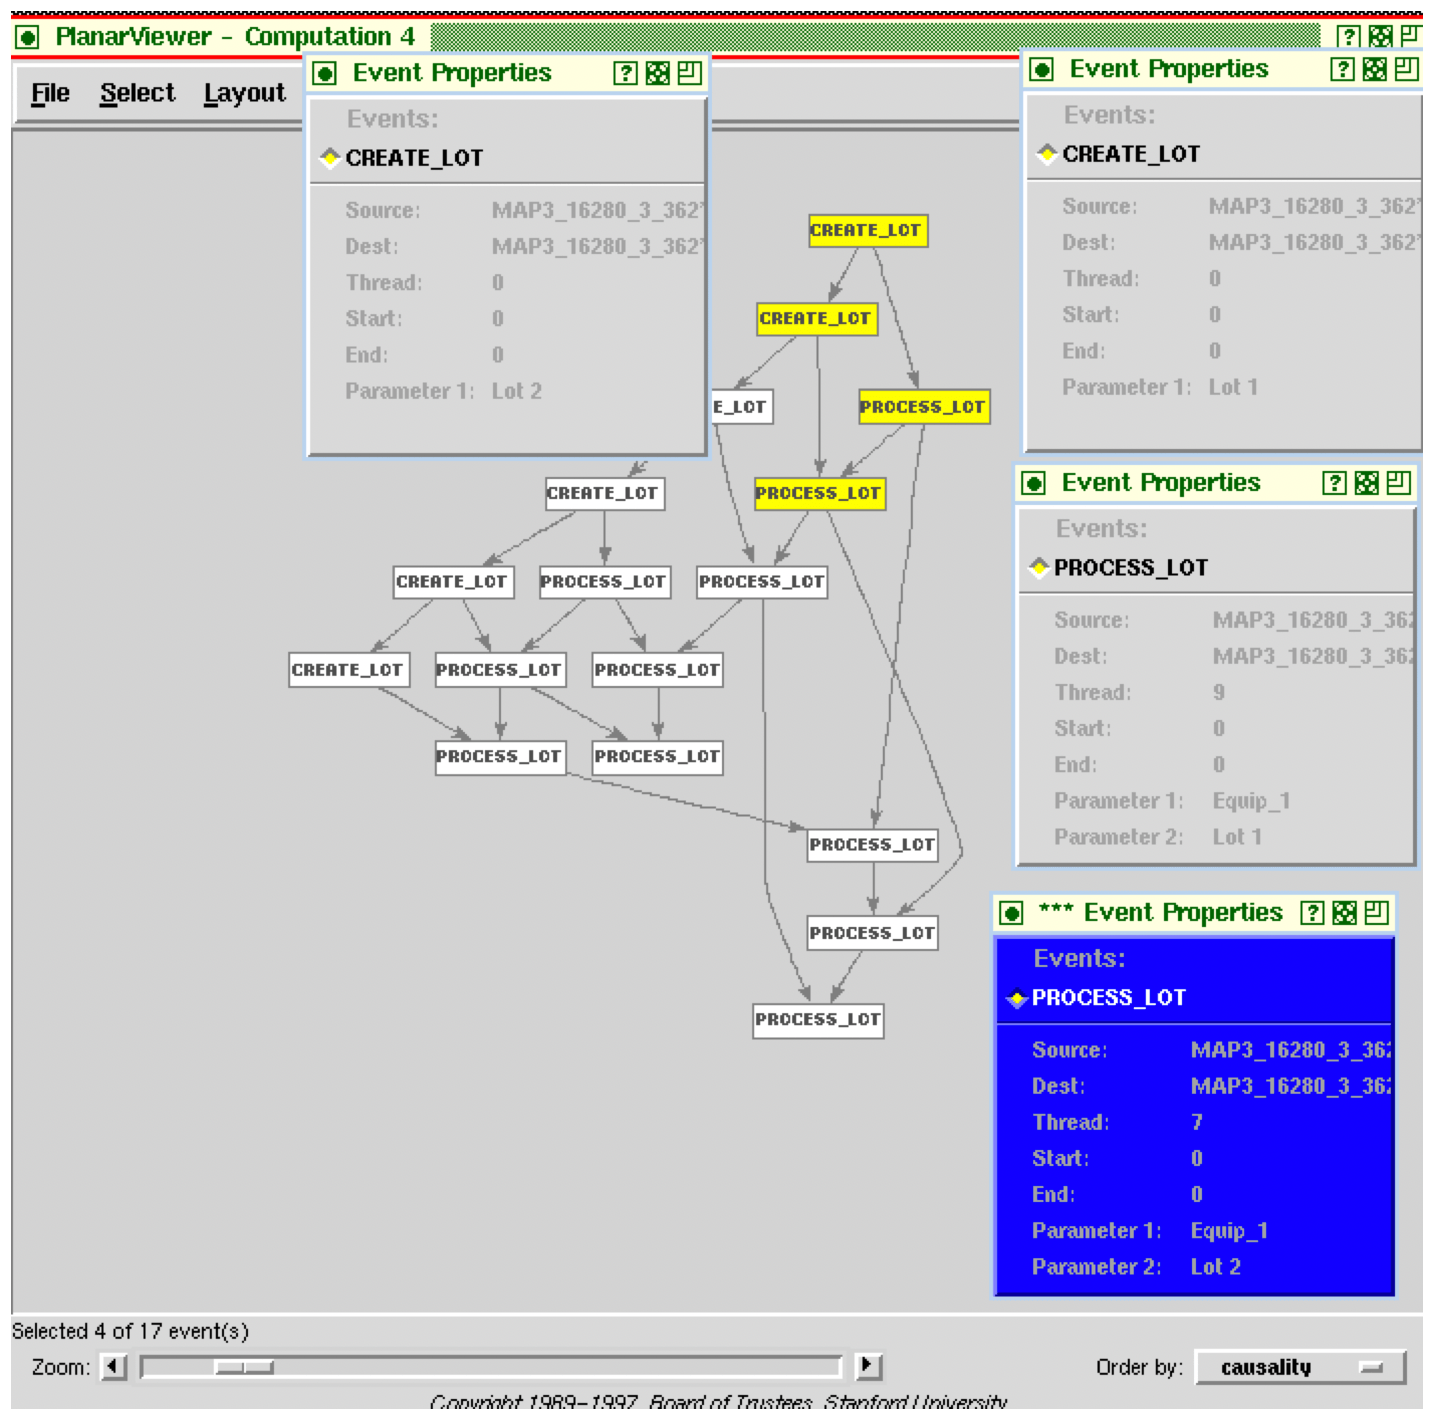
In fact, all Create Lot events were generated by the same thread, which is why they are in a linear causal chain. The first highlighted Process Lot event denotes an activity of Lot1 being processed on Equip1 (see the corresponding cut-off window showing Thread 9 generated this process Lot event with parameters Equip1 and Lot1). The creation and processing of the same lot are causally related. Similarly, the two high- lighted Process Lot events are causally related because they denote activities using the same Equip1. Equipment in this Fabline is a one-lot-at-a-time critical region. We can also see independent Process Lot events denoting activities with different lots on different equipment.
The causal relation in this example is computational causality. It results from the semantics of the language used to model the control computers and the middleware (in this case, RAPIDE).
- A Fabrication Process Management System
To illustrate complex event processing we use a scaled down model of a management system for a silicon chip fabrication line. These kinds of systems consist of several hundred computers communicating across a middleware layer. Figure 6 shows a small subset of a typical fabline configuration with eleven computers. It contains most of the interesting types of computer as described in [CS96], e.g., work in progress (WIP), material handling system (MHS), statistical process control (SPC), etc., and equipment control. In a fullscale system there are a lot more pieces of equipment and their control computers.
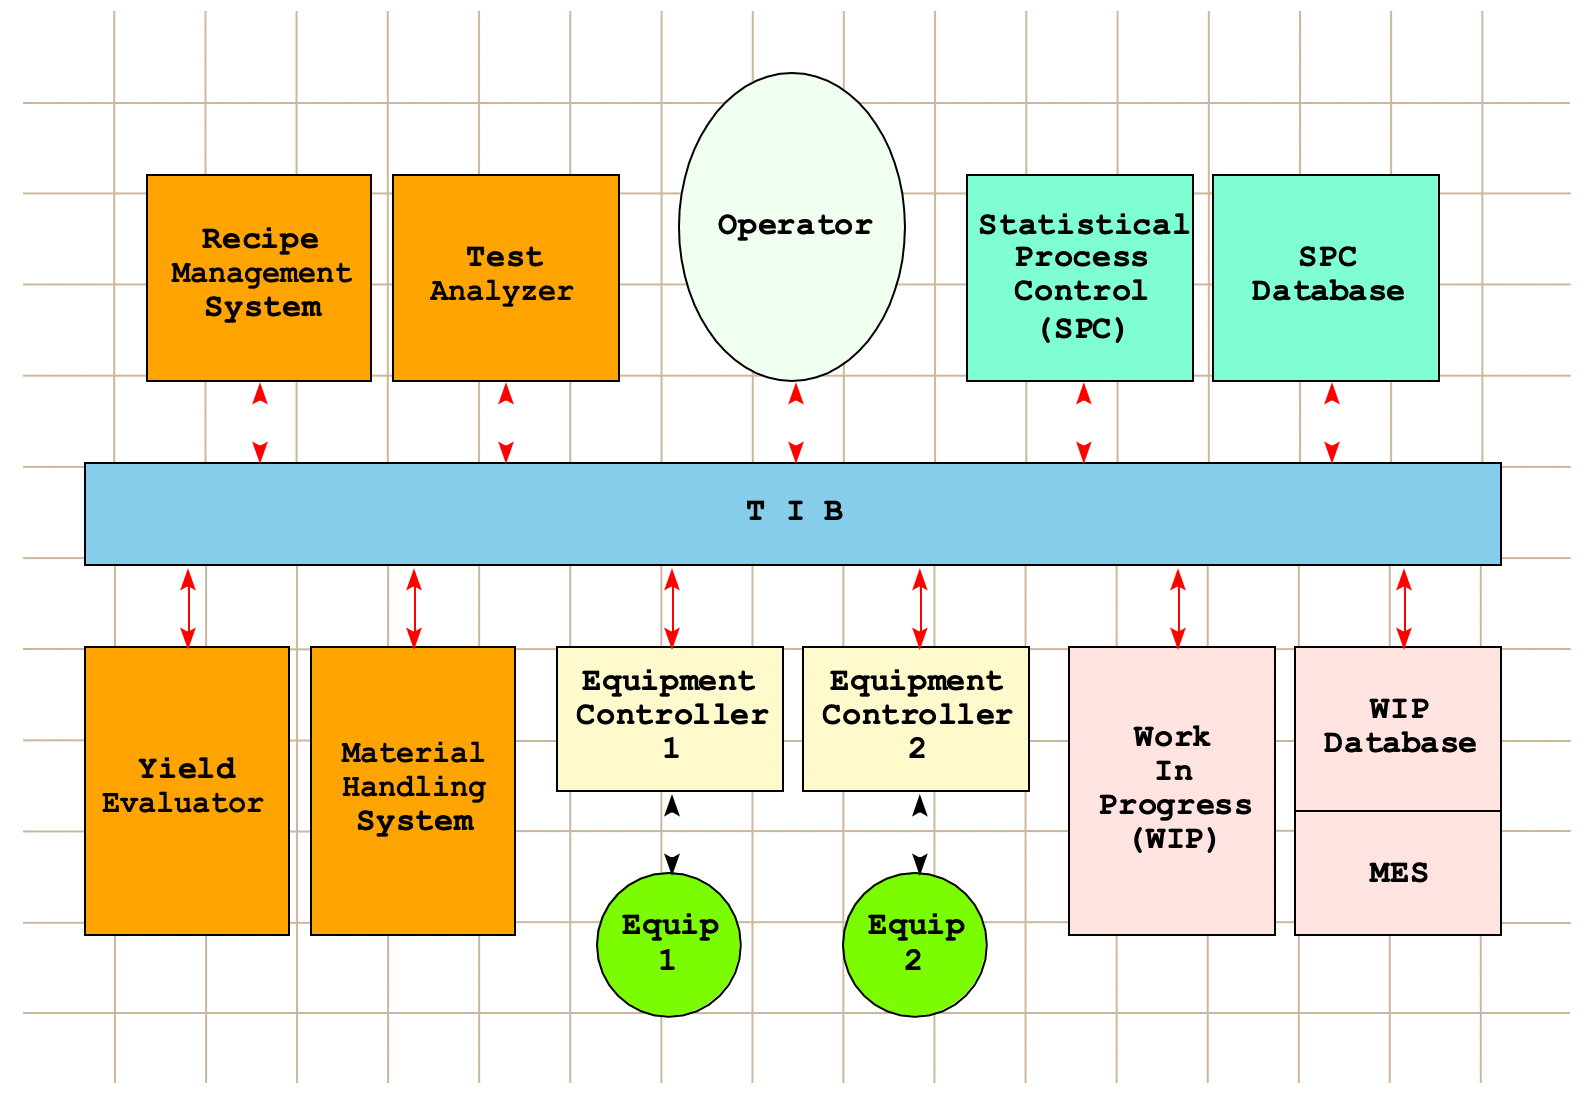
The model in Figure 6 also contains the communication layer, in this case TIBCO’s Rendezvous Information Bus (called TIB). The control system computers communi- cate by broadcasting and listening for messages on TIB. Typical events at this level are TIB Send( subject, data) and TIB Listen( subject, data). Several of these events in a correct sequence, make up a meaningful communication between a pair of computers. When one views the event traffic on the TIB one gets a jumble of Send and Listen events corresponding to different transactions between different system com- ponents. Figure 6 shows the architecture of the Fabline corresponding to the lowest abstraction level, the middleware communication level, of Figure 8.
Any particular computer listens for messages of interest to it and is deaf to all other messages broadcast on the TIB. So it is quite natural to define the next higher level of abstraction in an event hierarchy as a level which abstracts the TIB level message sequences into point-to-point direct communication between pairs of computers. A point-to-point communication happens when two computers broadcast and listen for each other’s messages according to some protocol. At this level the TIB is hidden — point-to-point could take place on any middleware.
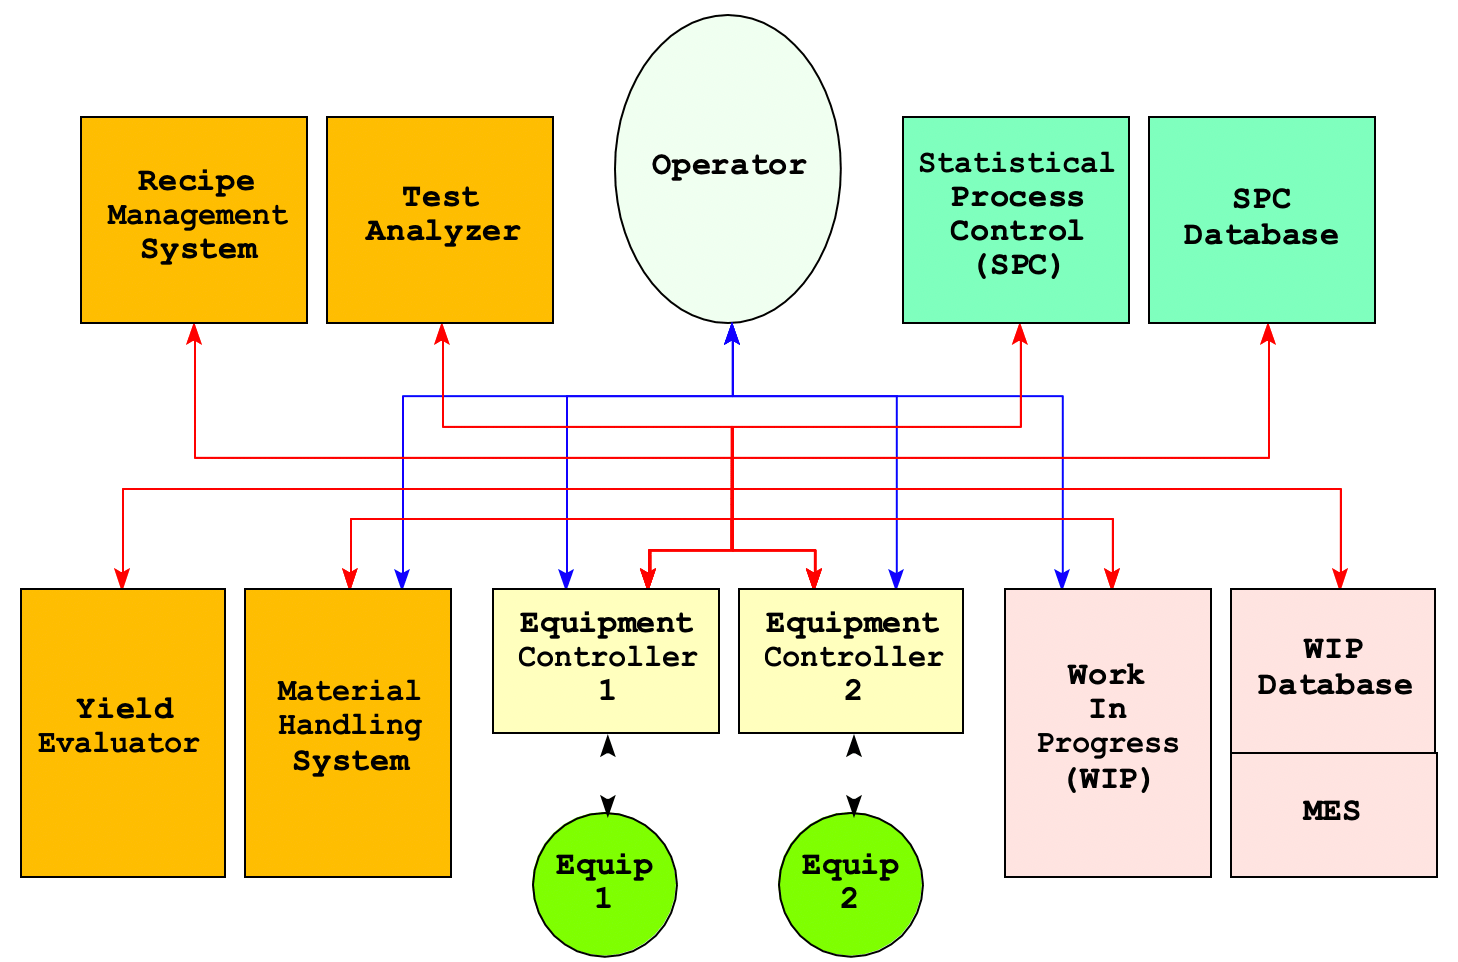
Figure 7 shows a subset of the point to point communication topology. Here, the blue lines show direct two-way communication between the operator and the WIP, controllers and material handling. The red lines show direct two-way communication between other components. There is no direct communication between some of the components, e.g., the operator and the test analyzer — a fact that is not obvious at level 1.
There are event pattern mappings that define how posets of events at the middleware level aggregate into single events at the point-to-point level. We discuss maps in the next section.
A 4-layer event hierarchy for the Fabline model is show in Figure 8. Events at a higher level are related to sets of events at the next lower level. For example, a Load Lot at level 3 corresponds to a number of point-to-point communication events between the operator and a controller at level 2 together with a particular causal relationship and data parameters. In the next section we illustrate how relationships between events at different levels are defined by event pattern maps. Note that the last column shows the number of events at each level in a simple scenario.
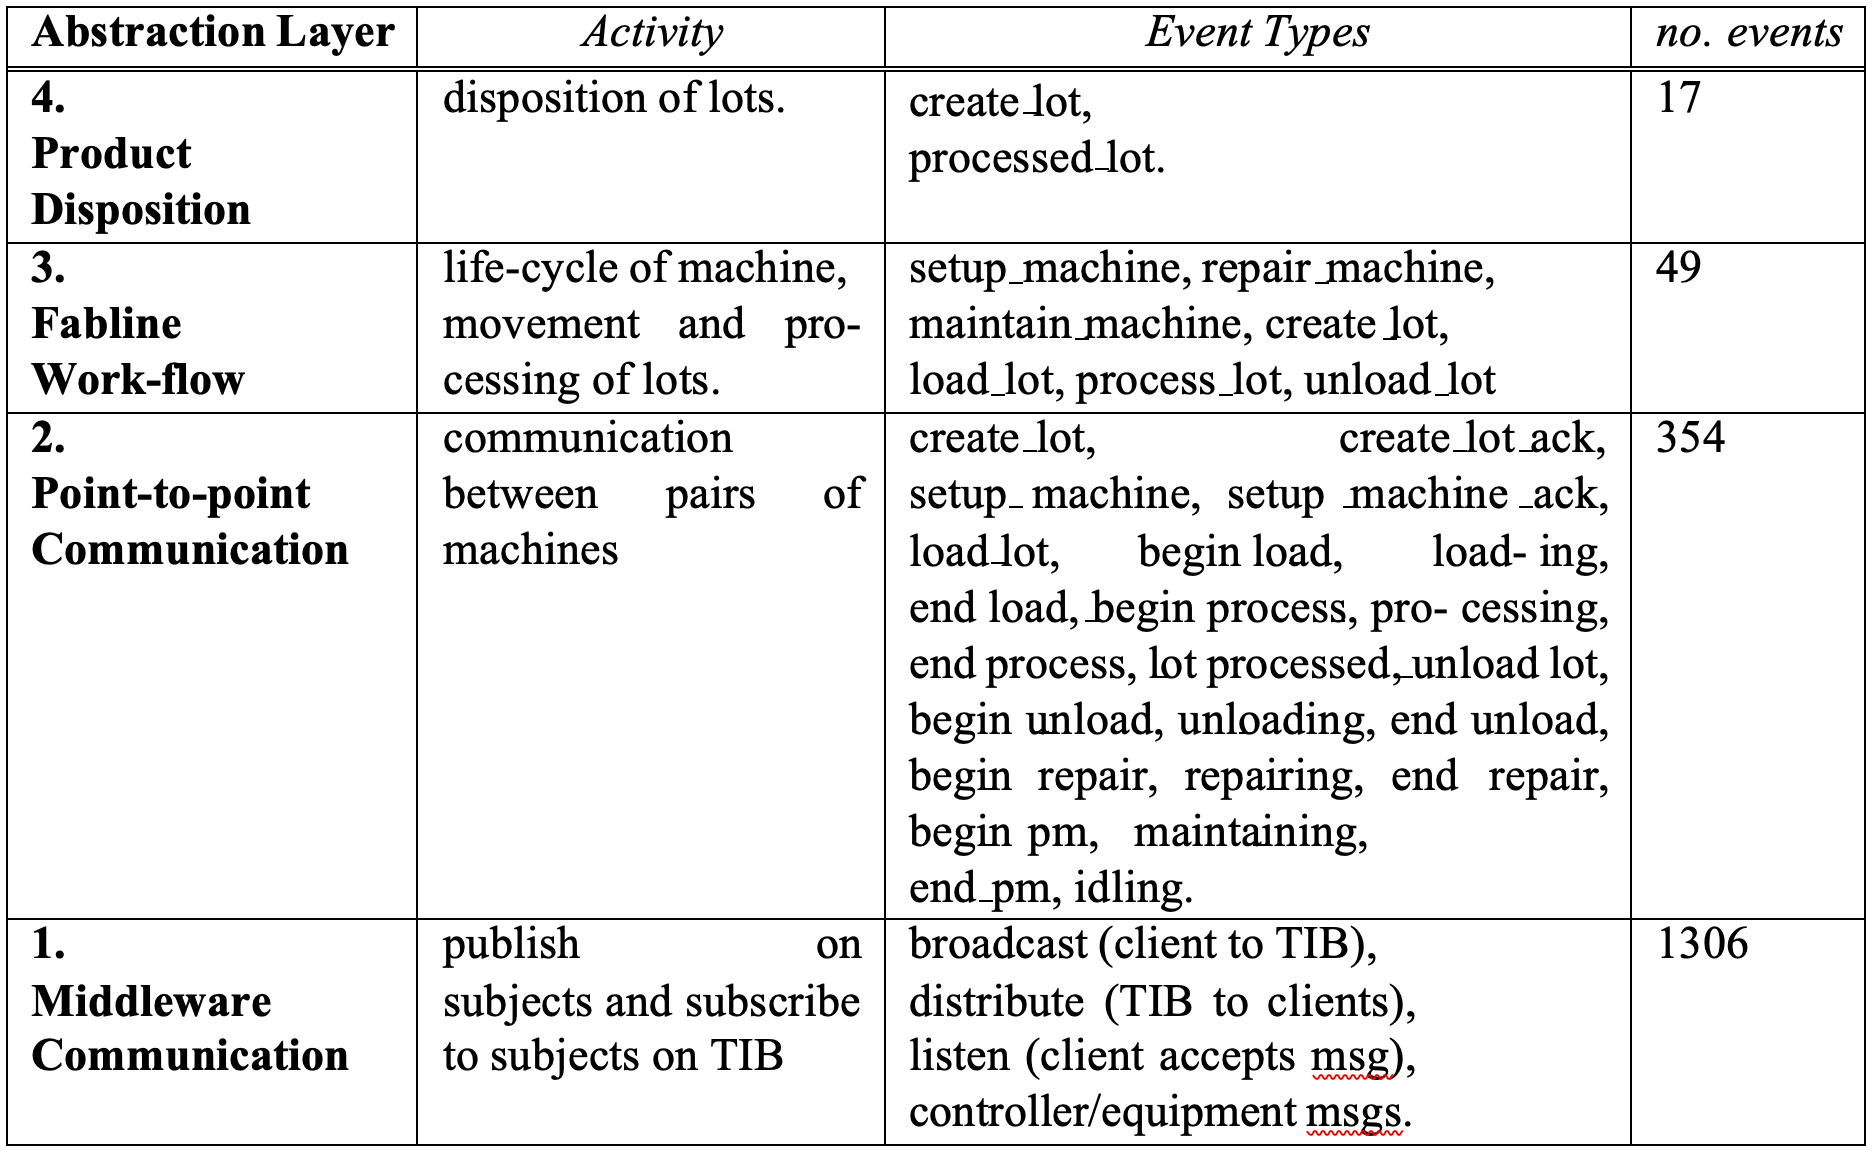
Different levels of events will be of interest to different people. The lower two levels, TIB level and point-to-point level, would be of interest to a Fabline control systems engineer. Such a person would typically view the Fabline activity at the point-to-point level because it contains fewer events and gives a precise picture of the attempted communications between the control computers. When something goes wrong, maybe a communication times out due to a lost message or a too slow response, the engineer would use the point-to-point view to separate out the TIB level events that are relevant to that error. This requires using not only the abstract point-to-point events and the actual TIB events, but also the mappings between them. We shall illustrate this later.
The workflow level will be of interest to a production engineer who is interested in ma- terial processing and throughput, and equipment maintenance and utilization. Events at this level have abstracted away all the communication between control computers. They denote activities dealing with introduction, processing and movement of lots, and various statuses of equipment. However, as we shall see, the systems engineer may also sometimes want to view at the workflow level.
The product disposition level deals with the manufacturing status of chip lots. All workflow activities have been abstracted away. This level would be of interest to upper management in the production and sales organizations.
Finally, it is important to emphasize that abstraction hierarchies are usually quite sub- jective. Only a few of them become industry standards. During the day-to-day opera- tion of a system various viewers may want to change portions of the hierarchy. RAPIDE allows us to change an event abstraction hierarchy simply by changing the event def- initions at various levels, and the event pattern maps. These changes can be made on the fly while the system is in operation and its middleware events are being monitored.
- Defining An Event Hierarchy
The hierarchy in Figure 8 is specified by event aggregation maps. A map is an object containing a set of mapping rules. Each rule is a pair of event patterns, a left and a right pattern. The map listens for events at one level and tries to match its left patterns against the incoming events. When a match happens, variables in that left pattern will be bound to objects in the matching event set so as to make the pattern and the event set identical. So, the result of a successful match is a binding of pattern variables to objects.
When a left pattern matches, the binding of variables to objects is applied to the corre- sponding right pattern. The result is an event, or in the general case, a causally related set of events. These right hand events are generated by the map. They will be events at the next higher level above the incoming event level. These virtual events are put out on the middleware for other maps to observe. So we can construct a hierarchy of event processing maps, as shown in Figure 4 corresponding to any abstraction hierarchy.
In the following figures we illustrate some of the mapping rules defining the Figure 8 hierarchy by left and right pictures of event patterns and corresponding virtual events. A left picture highlights in pink a poset of events matching the left pattern of the map, and the right picture shows the corresponding virtual events generated by the map highlighted in yellow. Tear-off windows show the parameters of a highlighted event on each side.
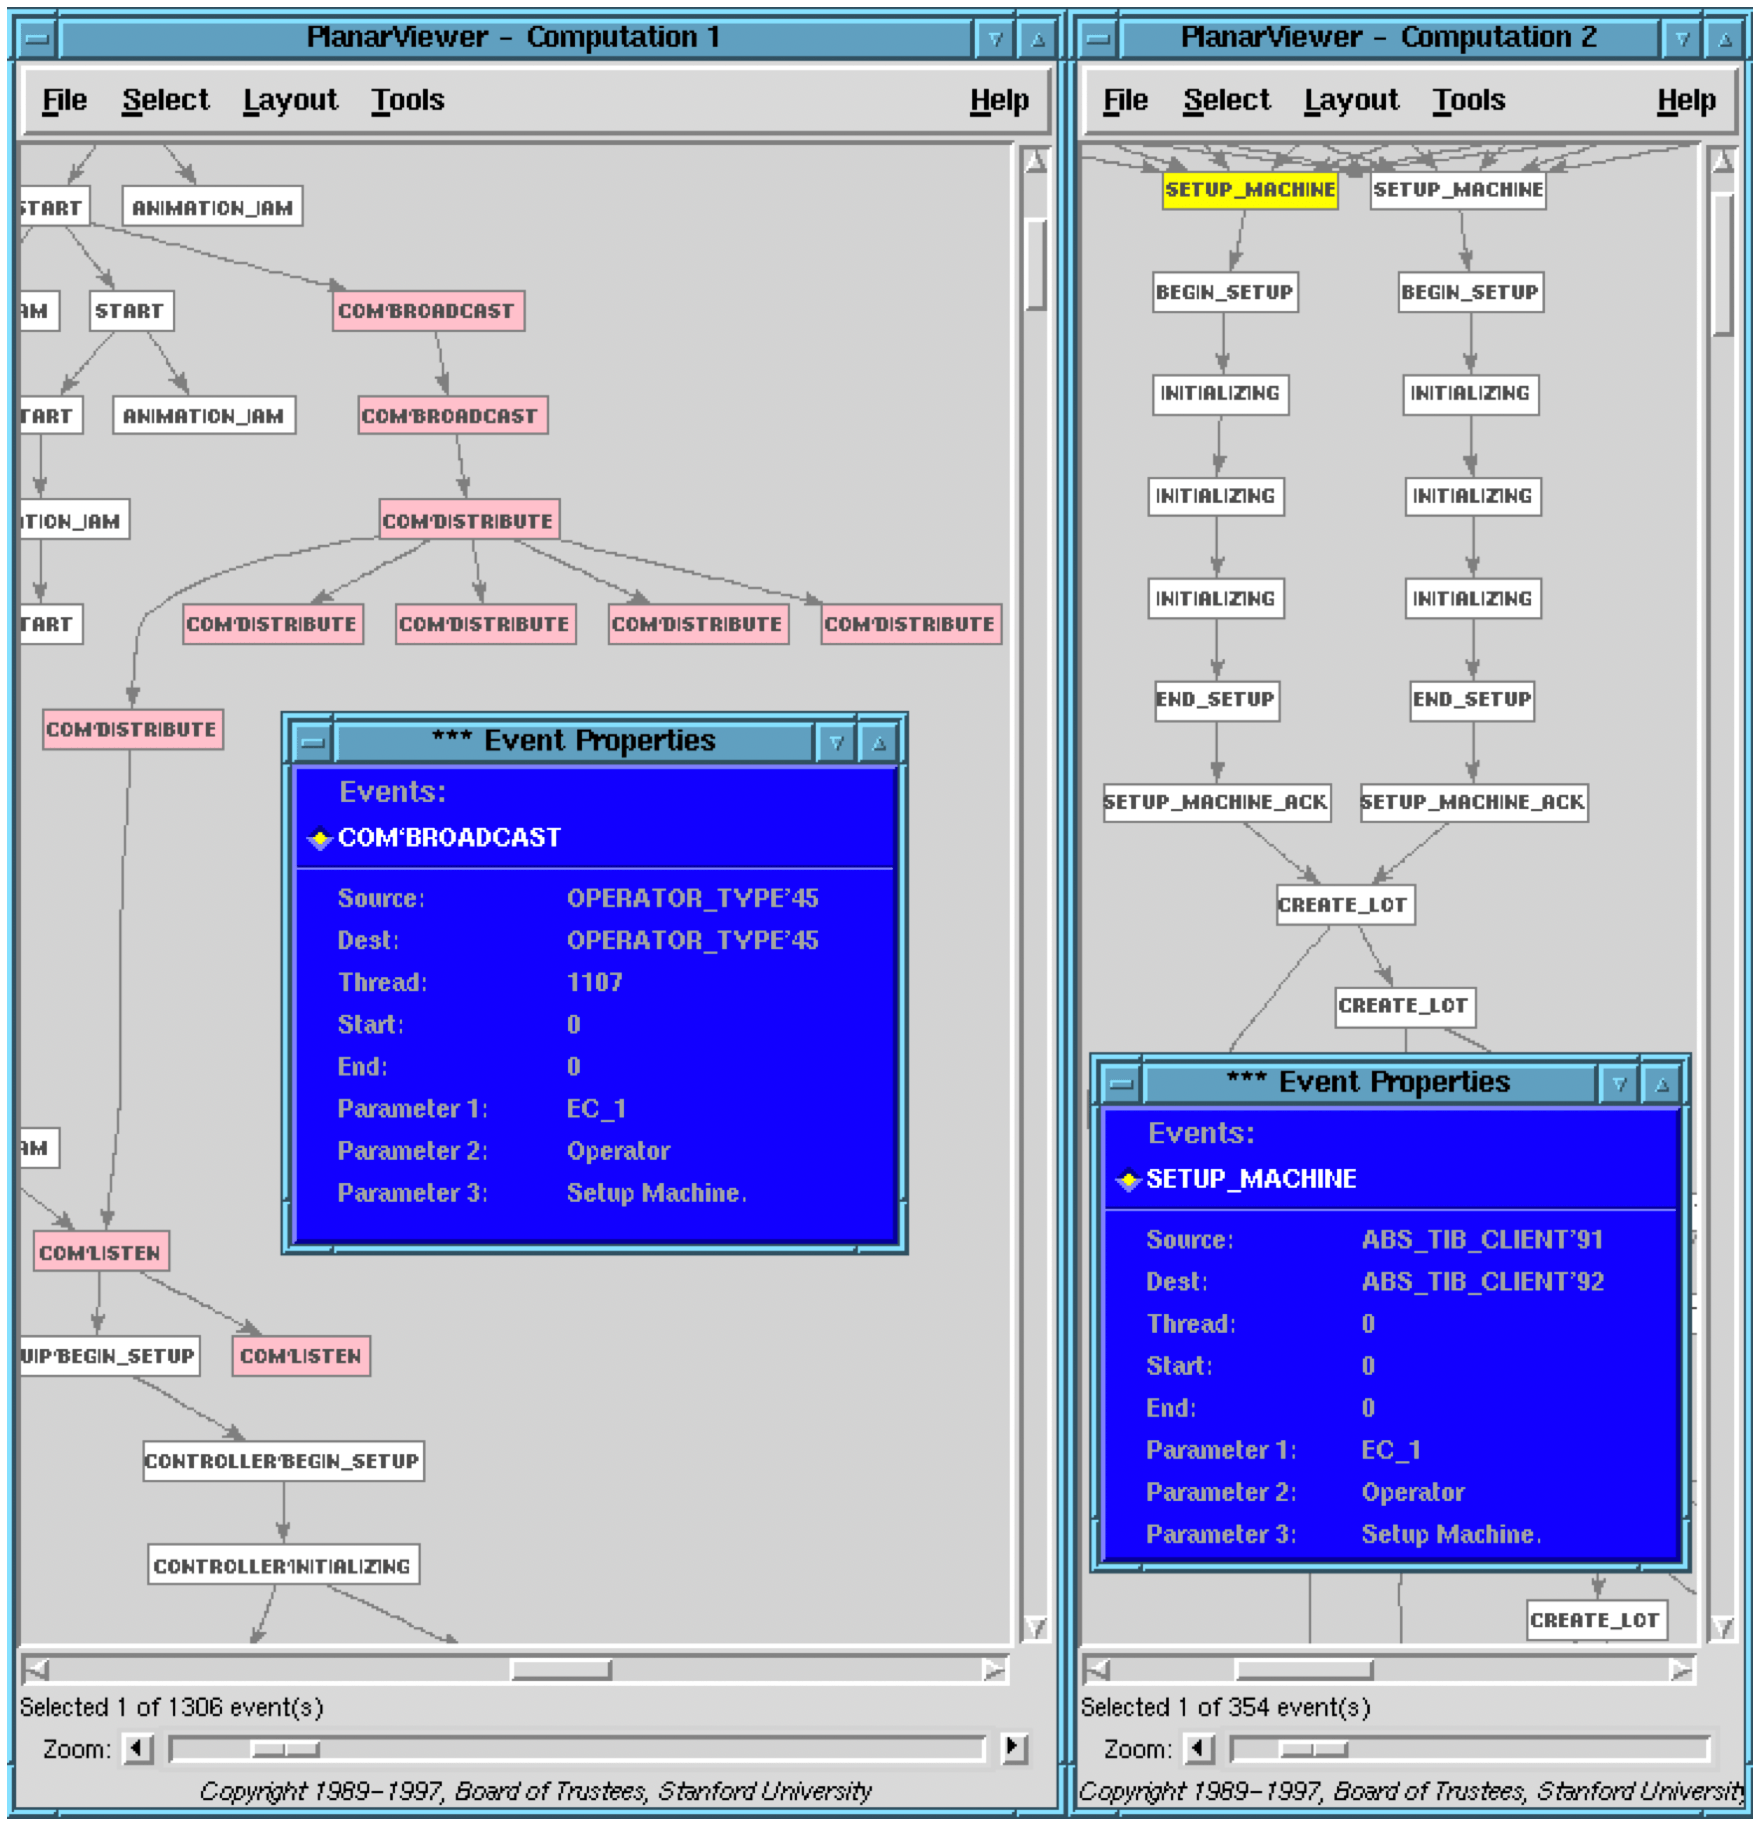
Figure 9 shows a mapping rule from level 1 to level 2. Its left pattern matches the highlighted set of middleware level events. This consists of a causal chain beginning with a broadcast event from the operator (as seen by the parameters in the tear-off window) across the middleware API which generates another Broadcast, followed by a middleware Distribute event which results in a fan-out of events to the middleware demons. One of these demons listens and passes the event on to its control computer. We have not shown all the data variables in the pattern, but the parameters of one of the events are shown in a separate window. The result of matching the pattern will be binding of pattern variables to these parameters. The resulting point-to-point level event is shown in the righthand picture. It is a Setup machine event (highlighted in yellow) communicated between the operator and a controller. The other righthand events are generated from the left-hand poset by other map rules.
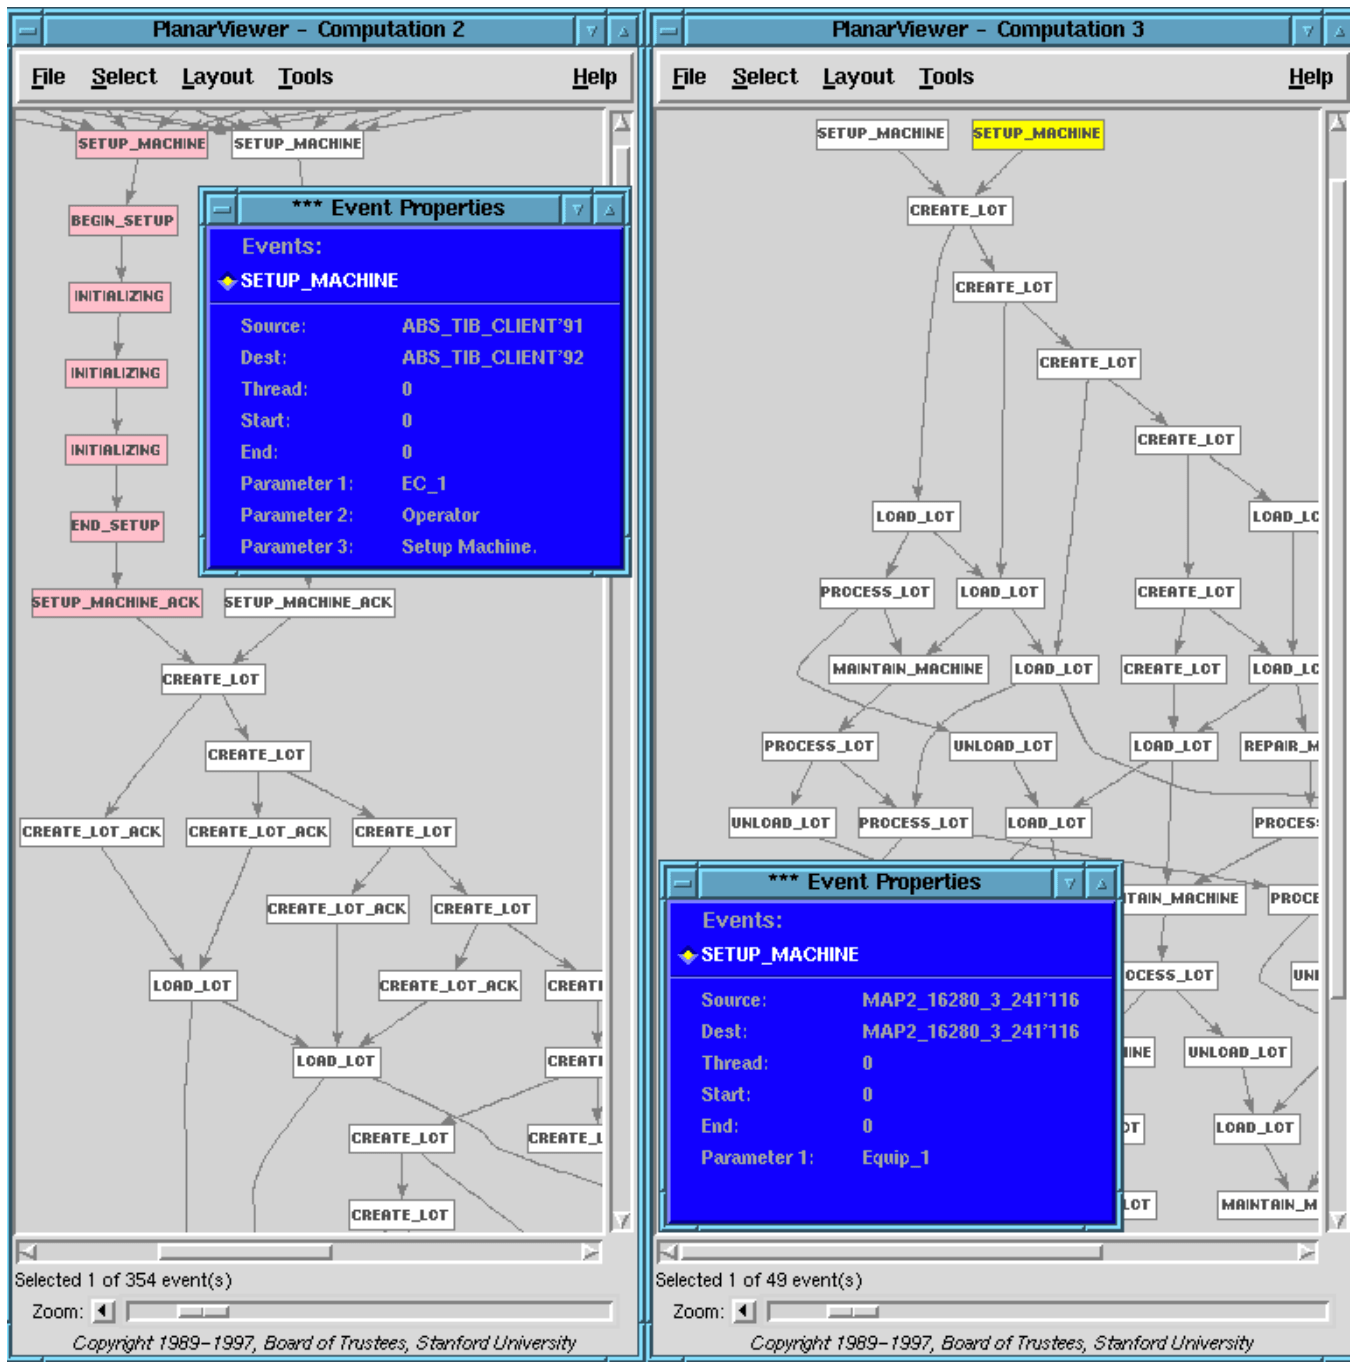
Figures 10 shows one mapping rule from the level 2 events for setting up an equipment to a single level 3 Setup event. The left pattern (in pink) matches a causal chain of Setup and Initialing events at level 2. These events, by the way, can be seen in the level 2 poset of Figure 9 used to illustrate the previous rule for mapping from level 1 to 2. This rule is processing the level 2 output from the previous rule.
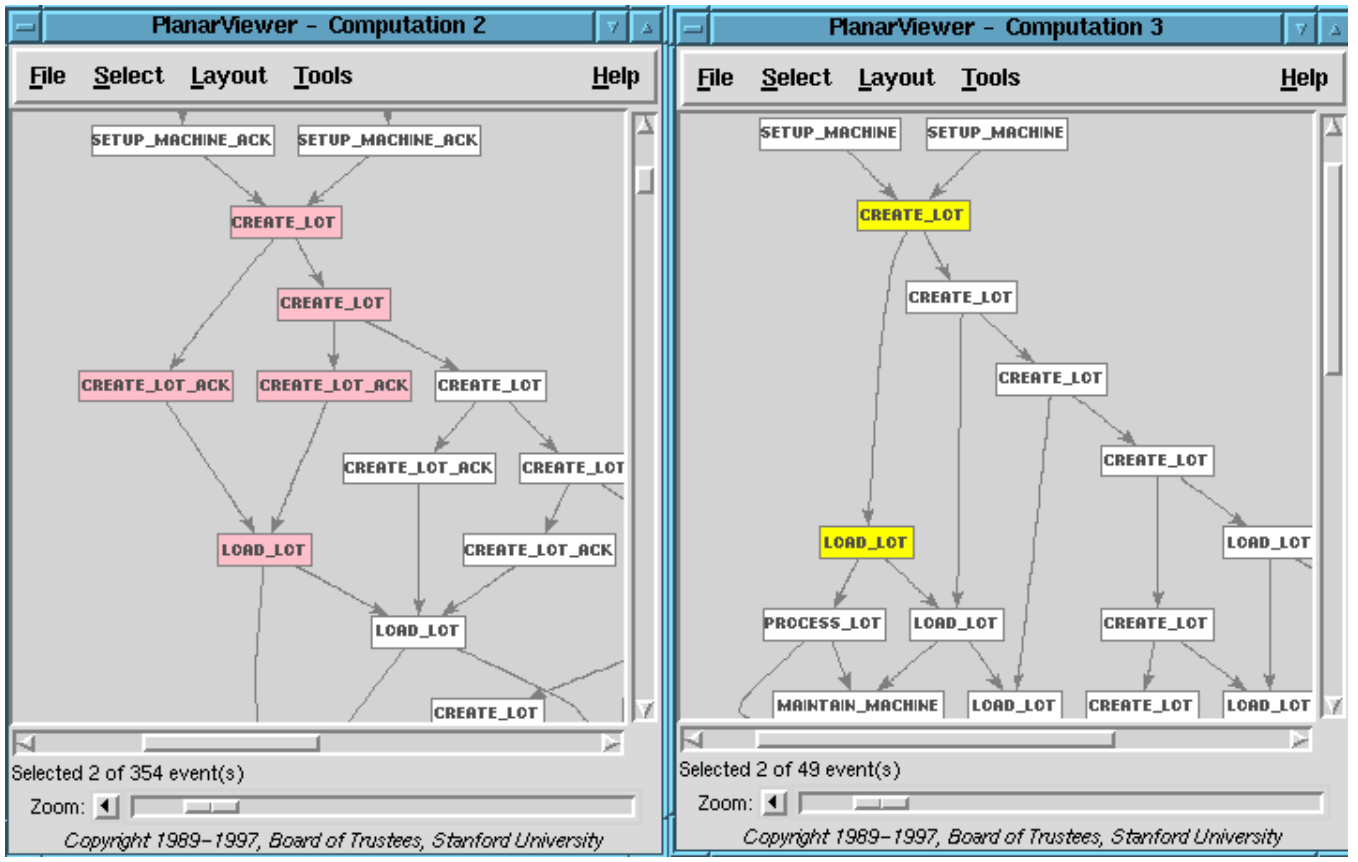
Figure 11 shows a second mapping rule from level 2 to 3. Its left pattern results in generating two causally related events (in yellow), Create lot followed by Load lot at level 3.
Figure 12 shows a mapping rule that processes level 3 events from the previous maps. It abstracts away the lot Load and Unload movements at level 3. It simply specifies level 4 events for creation of a lot, and events for when the processing of a lot by a particular equipment is completed. The machine statuses are abstracted out at level 4.
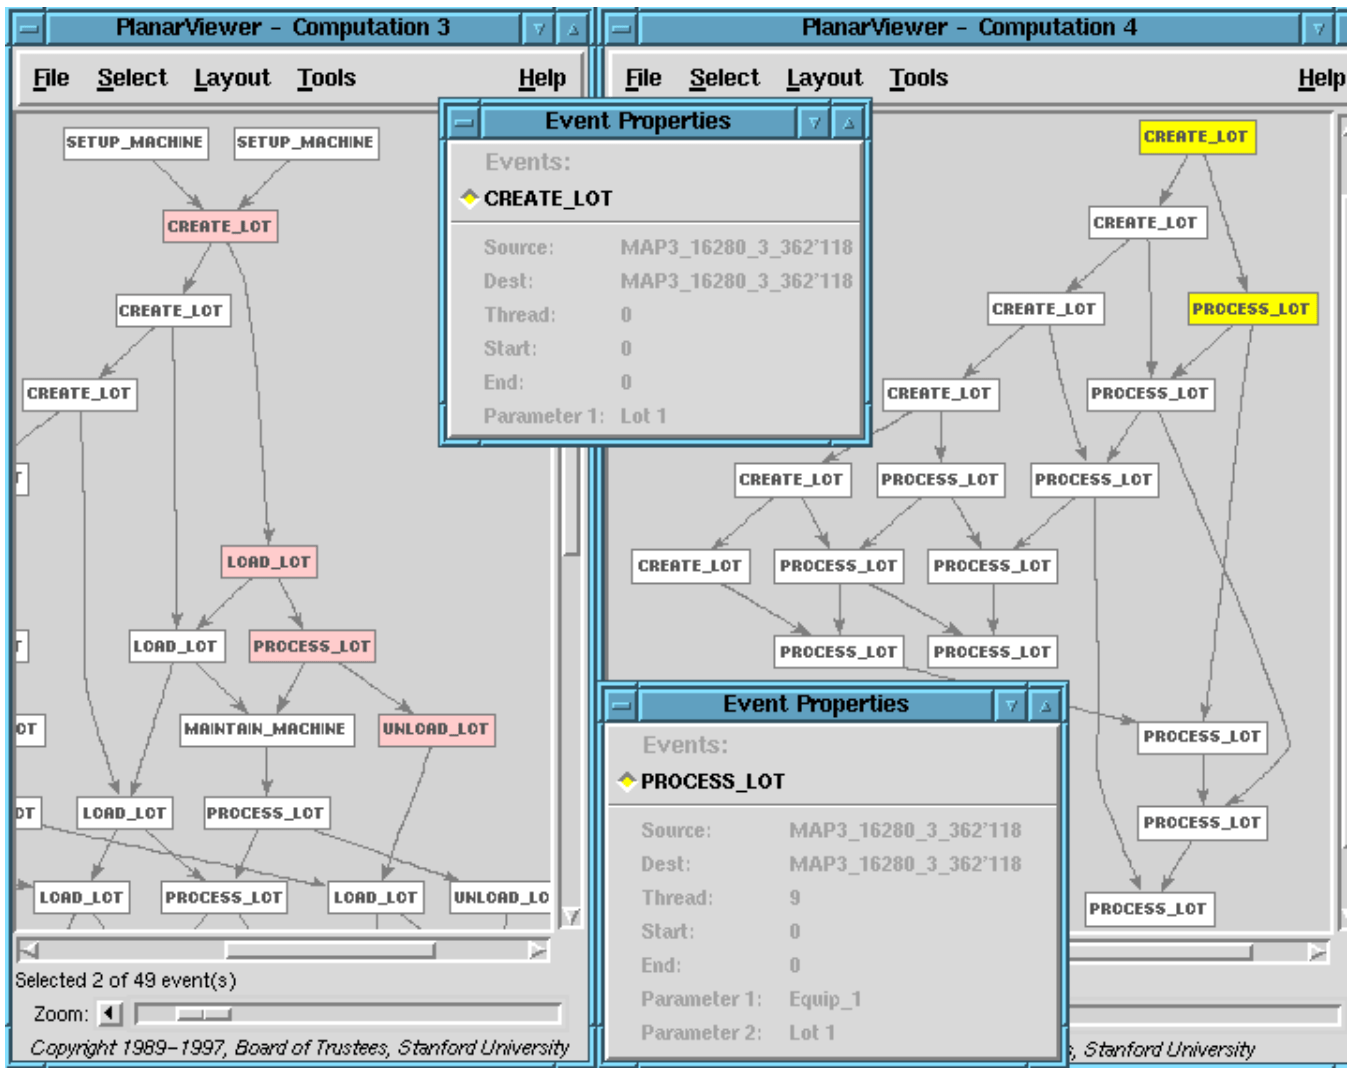
At this level we will view only the creation and completed processing of lots.
A rough heuristic guide for the number of maps used in defining an event hierarchy is that between any two consecutive levels there will be a mapping rule for each type of event in the higher level.
- Viewing an Event History Hierarchically
After we have defined the event aggregation maps between the levels of the event hierarchy, we can view the activity of the system at any of the four abstraction levels. To illustrate this the Fabline was run on a small scenario involving creation and processing of 6 lots on two pieces of equipment. The scenario is best explained at the Fabline workflow level of abstraction — level 3.
- The operator begins the scenario by sending messages to the MHS and to the WIP (some of them concurrently) that 6 new lots are being created.
- The operator then initializes (sets up) Equip-1 and Equip-2 by communication with their controllers.
- The operator then causes 3 lots to be loaded, processed and unloaded on Equip- 1, and the other 3 lots to be loaded, processed and unloaded on Equip-2. The activities on the two equipments take place independently. Each equipment can load and or process one lot at a time, but can do loading and processing concurrently.
- step 3 is then repeated. Lots processed on Equip-1 are then processed on Equip- 2, and conversely.
- During these steps, equipments may randomly undergo maintenance or repair.
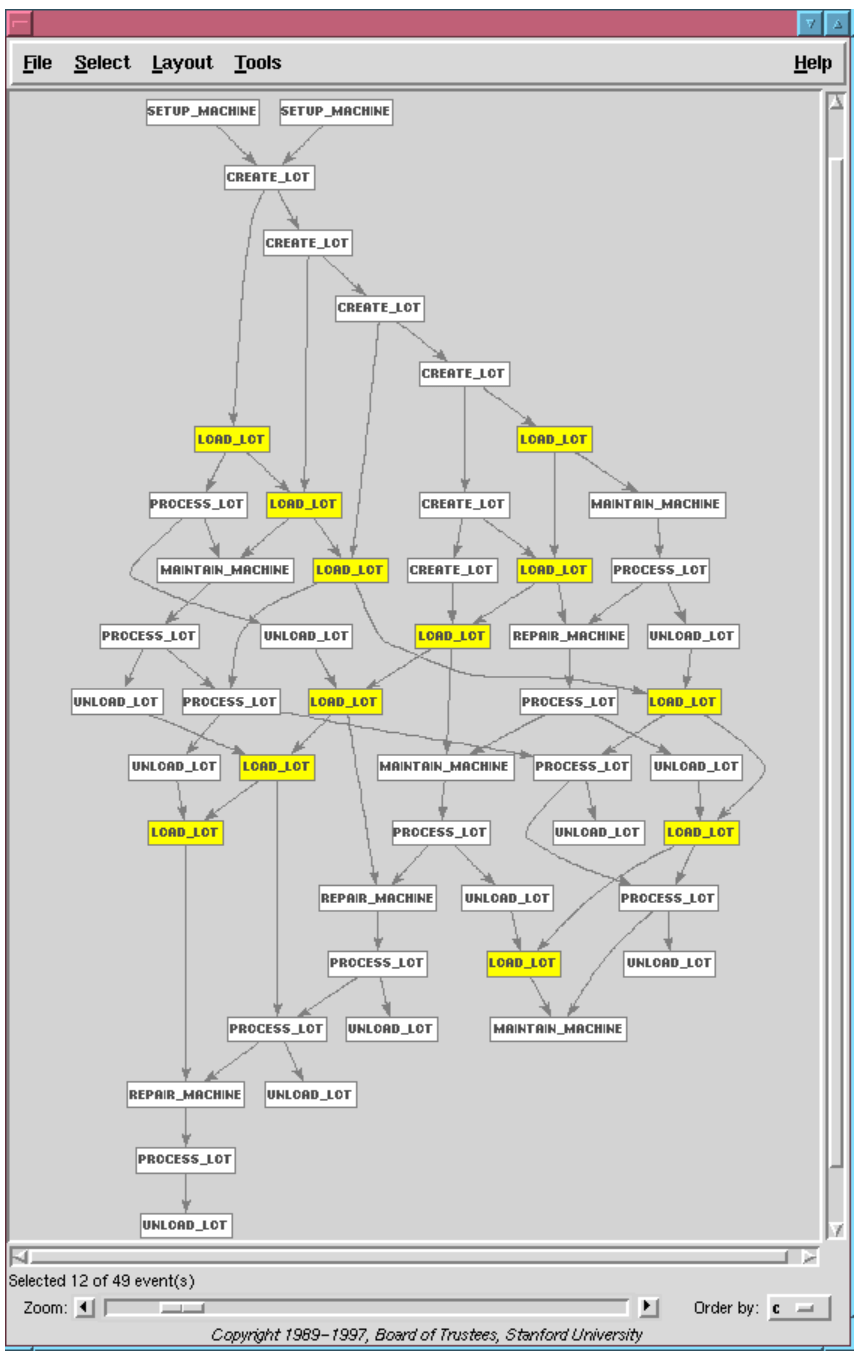
Figure 13 shows the poset generated by this scenario at level 3. The highlighted events show independent threads loading the first and second batches of 3 lots each. The first batch is loaded and processed on equipment 1 and then on equipment 2, while the second batch is processed in the reverse order. The independence of events in the two threads shows that the separate batches are processed concurrently as much as possible. This information would be lost if event causality was not represented. The poset also shows Maintenance events interspersed with processing events.
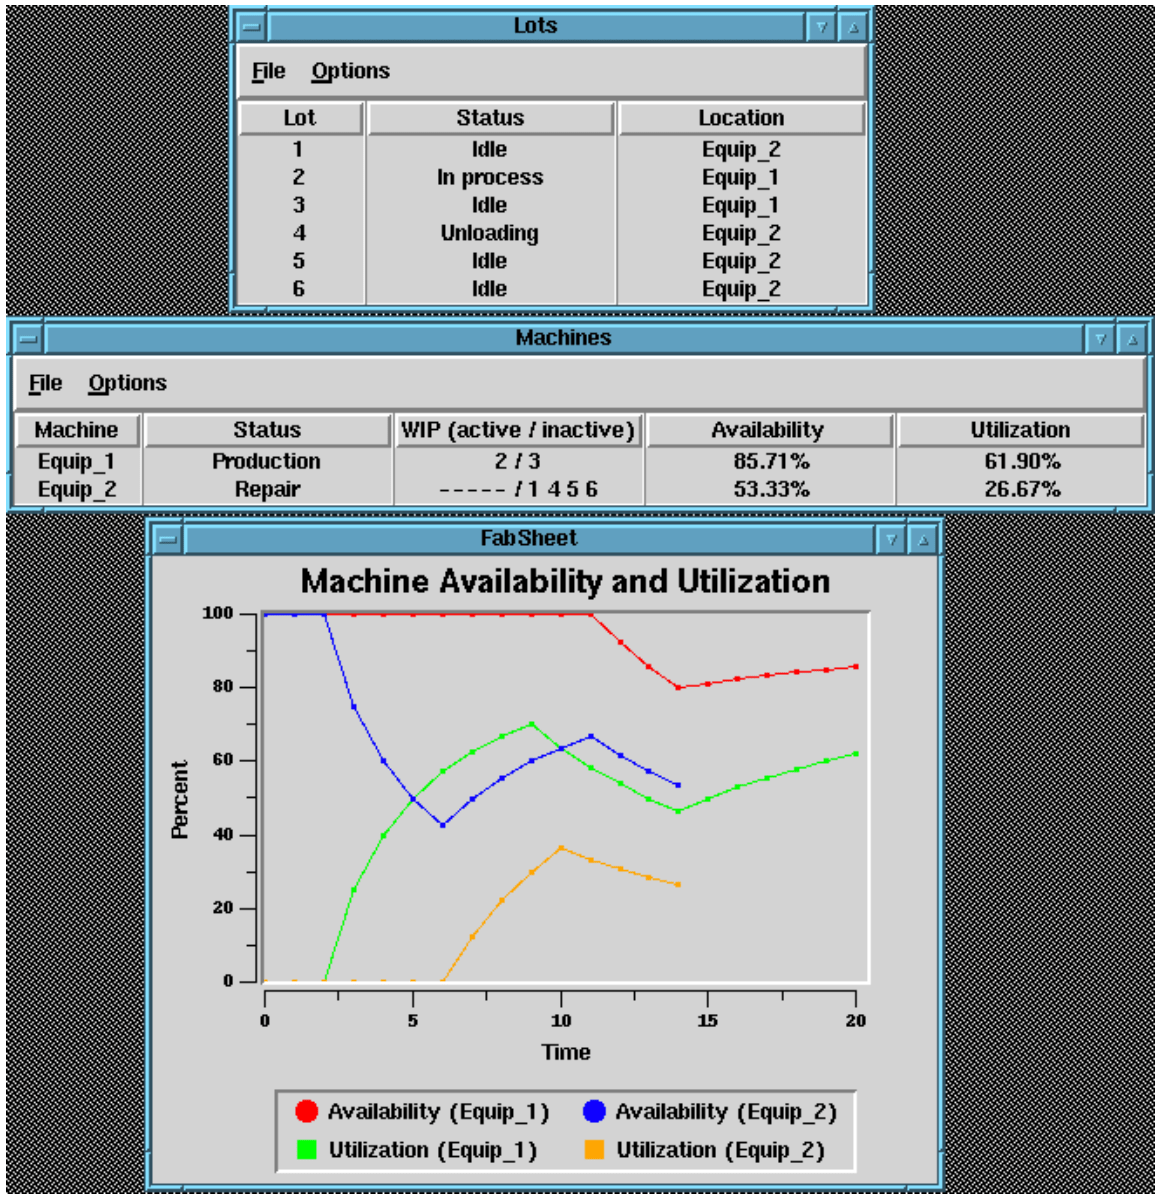
The level 3 events are fed to various event viewing tools shown in Figure 14. The tools summarize information contained in the level 3 events. One viewer shows the status of lots during the fabline operation. The other two viewers give different depictions of the status and availability of the equipment using formulas defined in [CS96]. This information has been aggregated by the maps from the data in events at level 1 and again from events at level 2. At the same time, the number of events is greatly reduced (see Table 8) and irrelevant TIB communication events are eliminated. So viewing at this level is much more efficient than trying to view level 1 or 2 events directly.
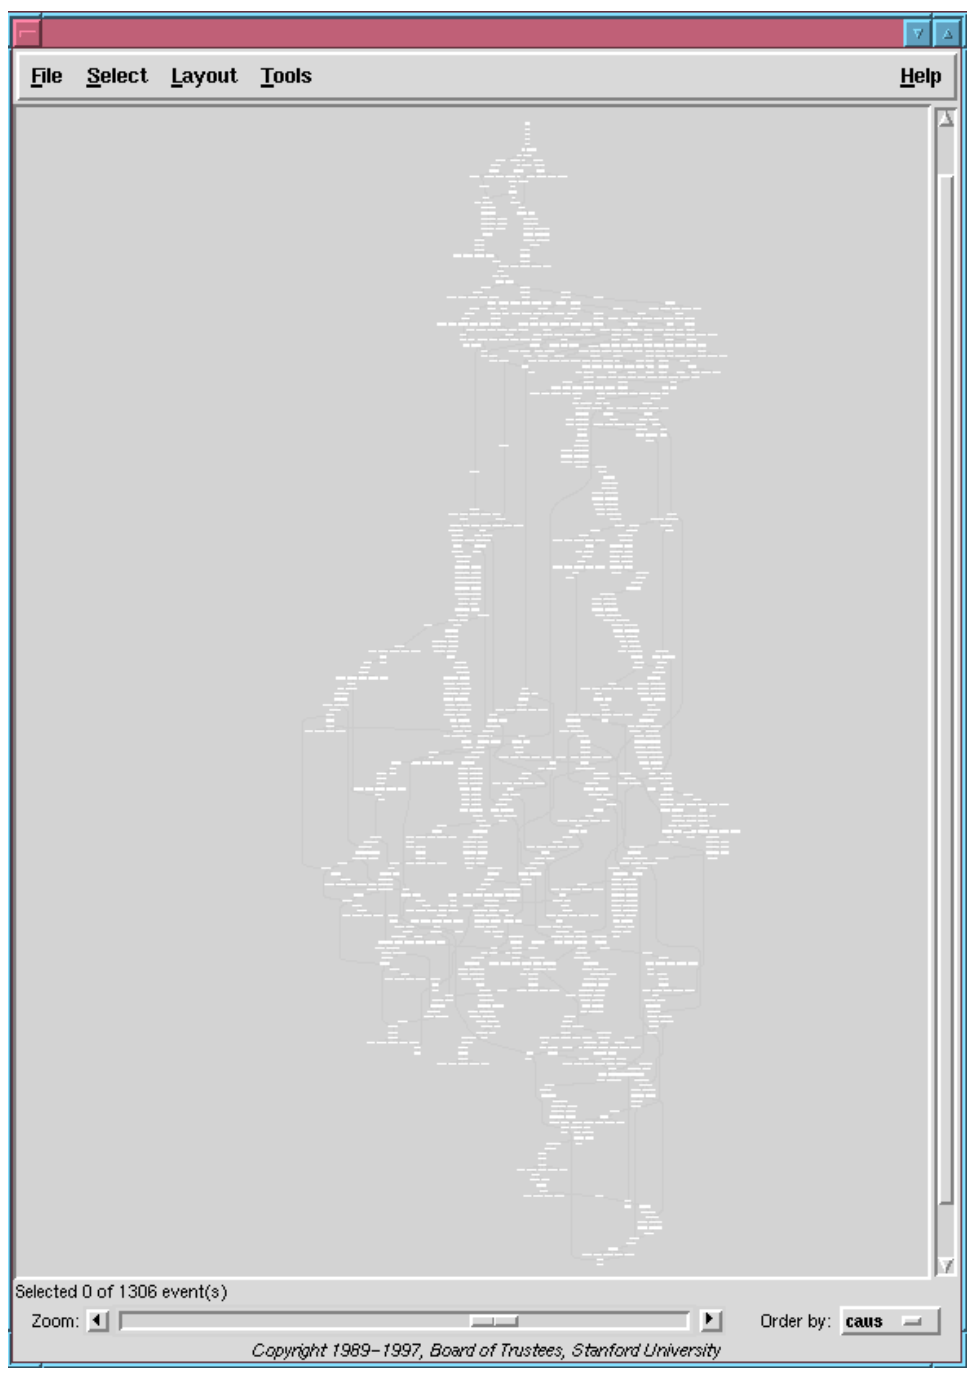
The poset of basic low level events from this scenario is shown in Figure 15. We can see the thread structure as a result of depicting causality although we can’t see any de- tails of events because there are too many. The viewer does allow us to magnify areas of the poset by zoom operations, so if we are on-line we can navigate around the poset and view details. This picture shows that there are between 8 and 10 main threads of control in action at various times. Roughly, these correspond to the active objects in the level 1 architecture shown in Figure 6. Sometimes we can recognize repeating patterns of events corresponding to, say the communication involved in processing a lot. But the viewer’s DAG layout algorithm is very sensitive so that repetitions of the same pattern of events may be displayed in different — but topologically equivalent — layouts. So it is very important to have an automated way of specifying and detect- ing patterns of events rather than to rely on human recognition. The RAPIDE causal event pattern language gives us a powerful technology for doing this. Pattern-directed viewing is supported by the RAPIDE viewer.
- Low Level Trouble Shooting From a High Level View
Networked systems like Fabline often experience low level faults which bring the system to a grinding halt. These faults can be very costly. Typically, the information bus can lose events, or the communication between the control computers is not ro- bust under timing delays. The middleware, the protocols or the software in the control computers could all be at fault.
When such faults happen, a maintenance engineer is faced with a large level 1 event log. It has been reported to the authors that such faults have taken a top class engineer up to two weeks to figure out. His first problem is to try to understand in terms of level 3 concepts what was going on when the fault happened.
In the following scenario we illustrate a process of hierarchical viewing, starting with the highest level view and working down the hierarchy using the aggregation maps to locate the low level source of a fabline fault. This is a very powerful tool for detecting low level faults quickly.
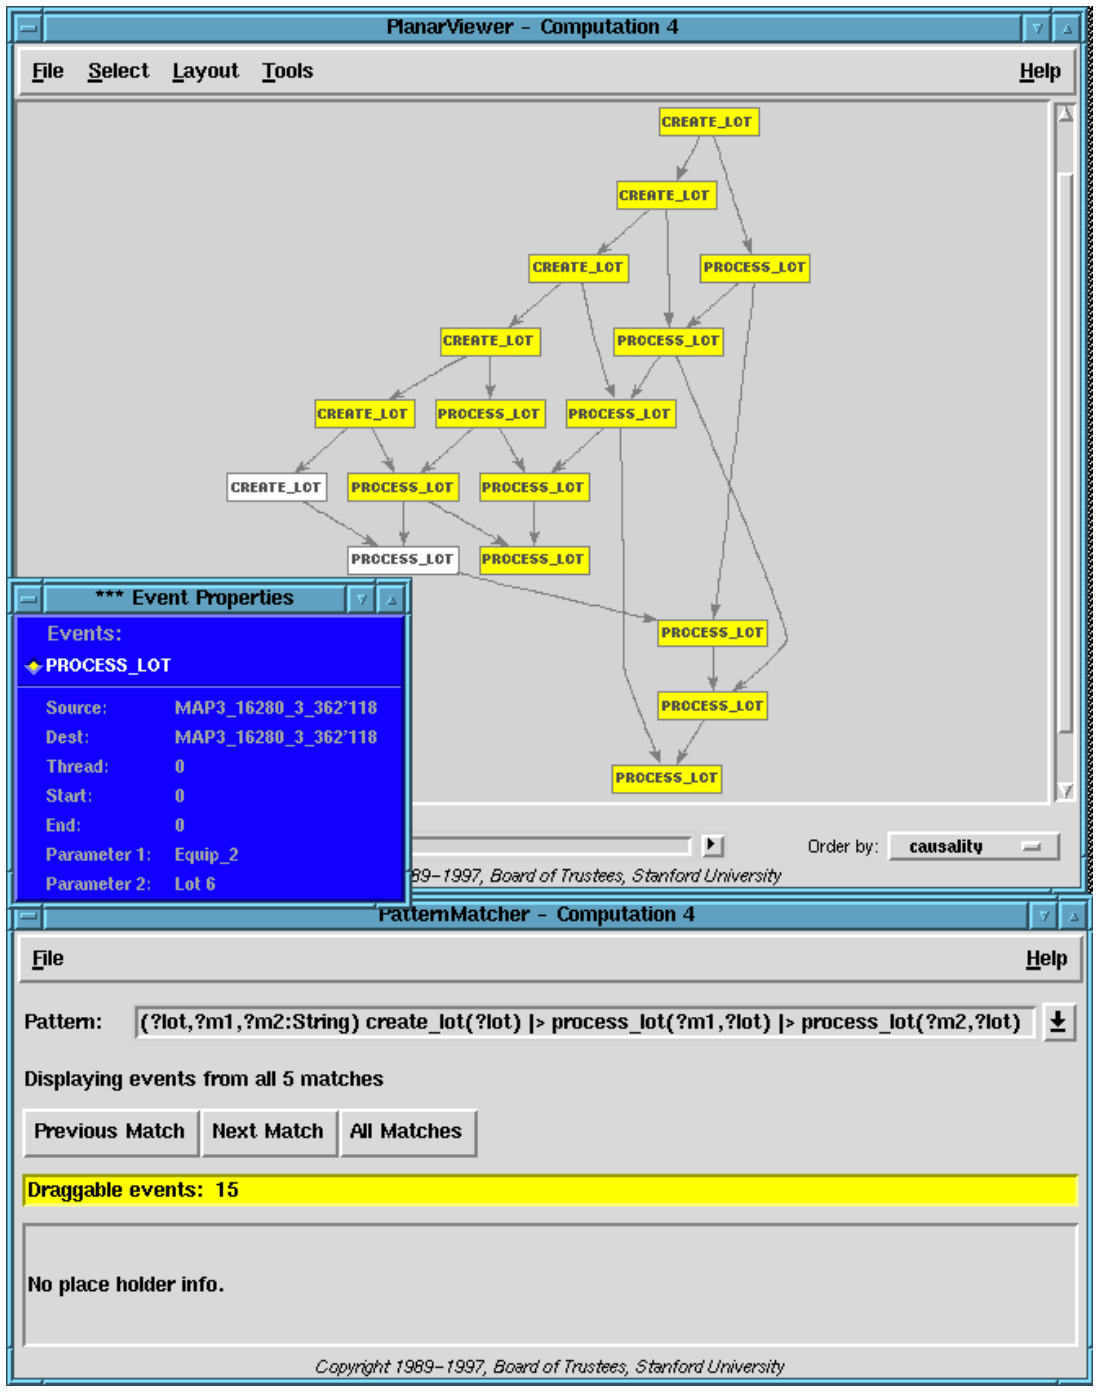
Let us start by viewing the level 4 picture of our scenario, Figure 16. It shows the creation and processing of 6 lots, each lot being processed by Equip 1 and then Equip 2 or conversely — except lot 6 which is only processed on Equip 2. You can’t see all the parameter data, but if you count the number of Process Lot events there are only 11, whereas there should be 12. So we know something has gone wrong.
At level 4 each lot should be seen as going through the same process: creation followed by processing on two pieces of equipment. The pattern specifying this process is a causal chain of 3 events shown in the pattern window in Figure 16. Notice the variables in the pattern are the lot and the machines. It matches any causal chain starting with a Create and followed by two Process Lot events for the same lot on different machines. You can’t see the guard, where ?m1 ?m2, because the pattern window is too short.
All the matches of this pattern are highlighted in Figure 16. There are two events left over, the creation of lot 6 and its processing on Equip 2. So it was not processed on Equip 1. Now we already know what high level operation failed — if we viewed only the middleware events we would have no idea.
Why didn’t lot 6 get processed on Equip 1? We need more details. So we go to level 3. And we look at just those level 3 events that led to the incomplete chain of events on lot 6 at level 4. To do this we use the hierarchy maps from level 3 to 4. Figure 17 highlights in pink those level 3 events that triggered the aggregation maps that generated the incomplete chain of two events at level 4 (shown in yellow). Here we are using a feature of the RAPIDE toolset which records those lower level events that trigger an aggregation mapping and result in a higher level event. This allows us to find the lower level events that were aggregated into any set of higher level events. Figure 17 shows that the causal chain of pink events involving lot 6 continues with a Load Lot event signifying the lot 6 was loaded on Equip 1. Then the equipment was taken down for maintenance. When it came back on line, the processing step at level 3 did not happen. Why not?
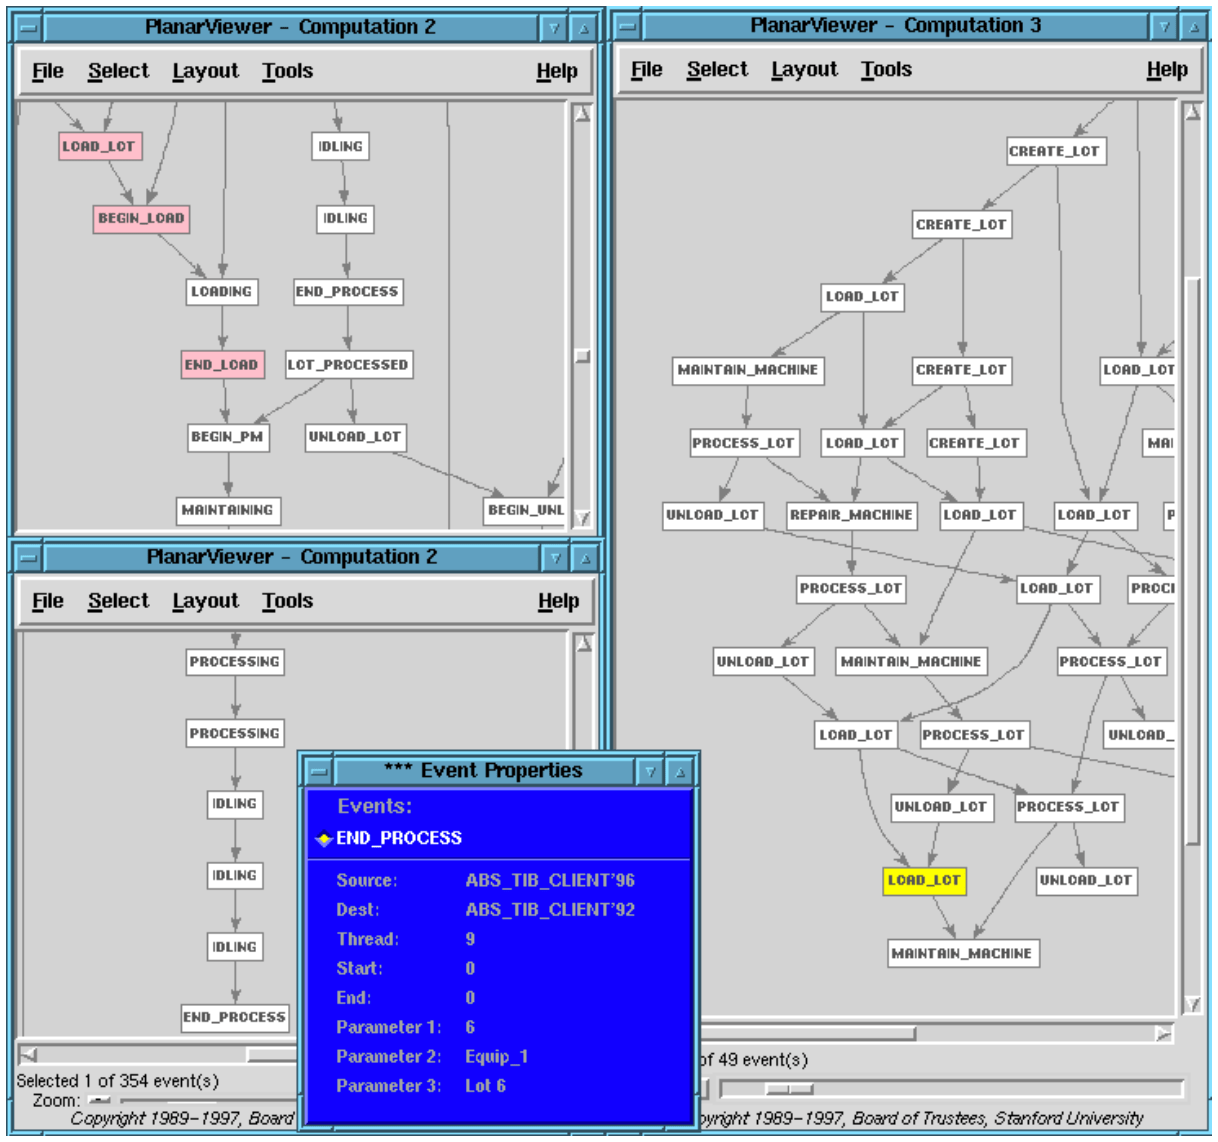
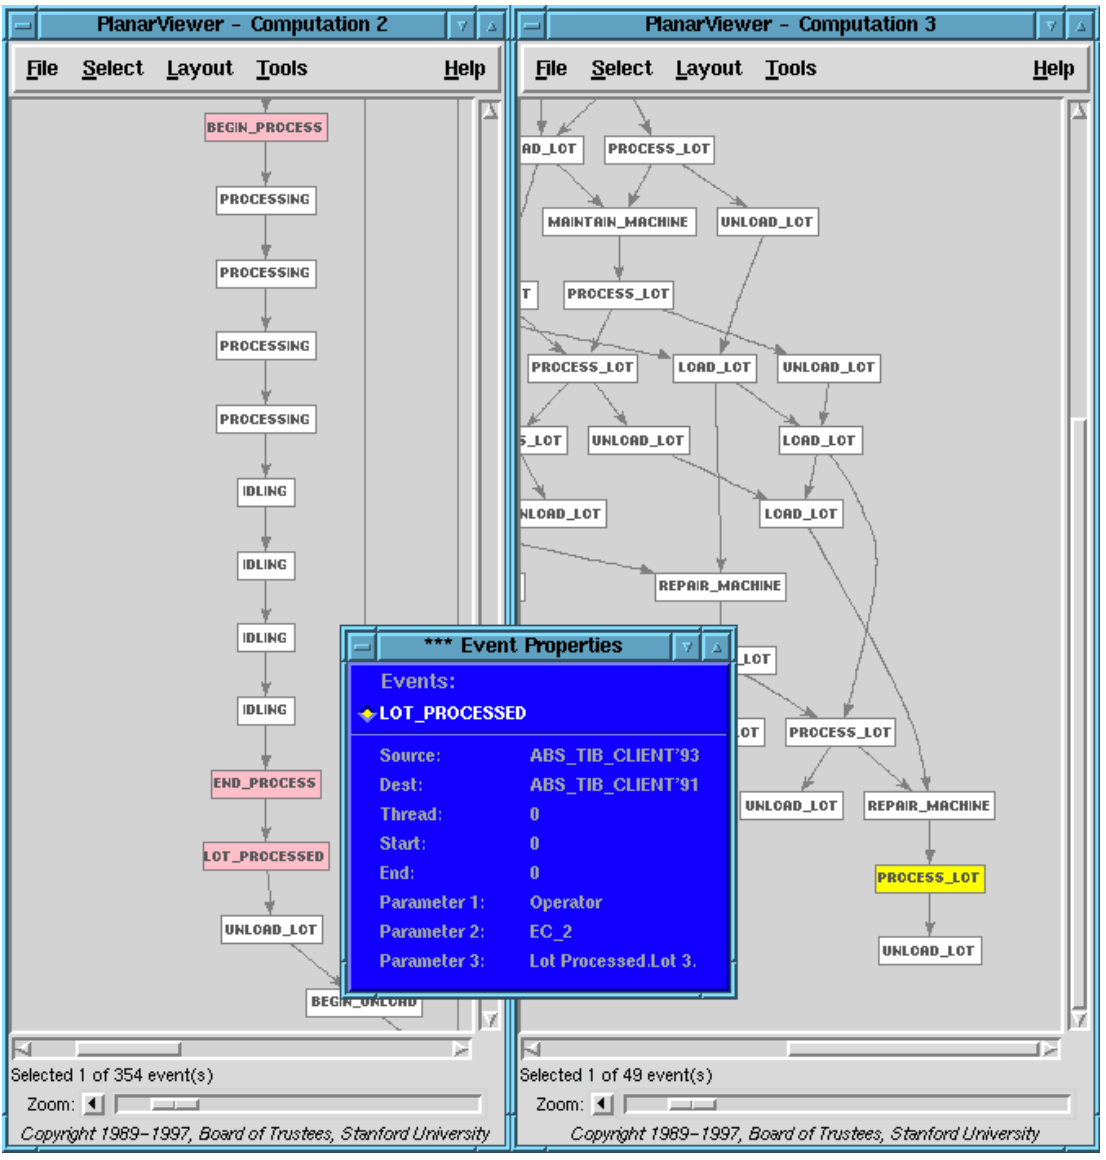
Down to level 2. We use the maps from level 2 to level 3 to view the level 2 events that were aggregated into the final Load Lot event at level 3, signifying loading lot 6 on equipment 1. These level 2 events are highlighted in pink in Figure 18. Following that causal chain, we see in Figure 19 that the preventive maintenance ended and the processing of lot 6 did in fact take place on equipment 1. We see that the operator was notified that the lot had finished processing. Going further we will find that the operator failed to respond to this message.
- Conclusions
This paper has outlined a method of specifying abstraction hierarchies to define lev- elwise views of a distributed message-based system. This methodology utilizes event pattern mappings. We have also illustrated a process for employing hierarchical views to quickly zero in on the low level causes of errors in such systems.
Event pattern languages are a fundamental technology for extracting information from distributed message-based systems. They are the underlying basis for specifying abstraction hierarchies by means of event aggregation maps, and for automated monitoring and aggregation of data from communication layers. The actual expressive power required of an event pattern language depends upon the nature of the information required and the abstraction hierarchy needed to specify it. The RAPIDE event pattern language includes causal and timing relationships between events, as well as the usual set-theoretic relations, and is probably the most powerful event pattern language required for complex event processing.
Footnotes
*This project is funded by DARPA under ONR contract N00014-92-J-1928 and Air Force Rome Labs Grant F30602-96-2-0191, and by AFOSR under Grant F49620-95-1-0093
yWe are indebted to members of the RAPIDE project who built the Rapide tools that were used in this study, and for helping with the study: Marc Abramowitz, John Kenny, Walter Mann, Sigurd Meldal, Woosang Park, Louis Perrochon, Alex Santoro, James Vera.
? This is implemented by a subject addressing scheme in TIB — one listens for subjects of interest.
References
[CS96] Chang C.Y. and Sze S.M. ULSI Technology. Electrical and Computer Engineering. McGraw – Hill, 1996.
[Gro91] The Object Management Group. The Common Object Request Broker: Architecture and Specification. The Object Management Group, revision 1.1 edition, December 1991.
[Int87] International Organization for Standardization. Information processing systems – Open Systems Interconnection – Specification of Basic Encoding Rules for Abstract Notation One (ASN.1), December 1987. International Standard 8825.
[LKA+95] David C. Luckham, John J. Kenney, Larry M. Augustin, James Vera, Doug Bryan, and Walter Mann. Specification and analysis of system architecture using Rapide. IEEE Transactions on Software Engineering, 21(4):336– 355, April 1995.
[LV95] David C. Luckham and James Vera. An event-based architecture definition language. IEEE Transactions on Software Engineering, 21(9):717–734, September 1995.
[TIB] TIBCO. http://www.tibco.com/.
Leave a Reply
You must be logged in to post a comment.